Research Article: 2021 Vol: 25 Issue: 5
Building the Competitiveness of Makassar Industrial Park as Center for Economic Growth in South Sulawesi
Saldy Mansyur, Hasanuddin University
Abdul Rahman Kadir, Hasanuddin University
Madris, Hasanuddin University
Citation Information: Mansyur, S., Kadir, A.R., & Madris. (2021). Building the competitiveness of makassar industrial park as center for economic growth in south sulawesi. Academy of Accounting and Financial Studies Journal, 25(S4), 1-11.
Abstract
It is recognized that Covid-19 has affected the performance of all business organizations around the world. Likewise, the impact extended to the accounting functions in all its forms, in addition to those in charge of the audit process, as Covid-19 created many challenges that affect the audit evidence. This study aimed to evaluate the effectiveness of reducing these challenges in organizations that use Computer Assisted Audit Techniques (CAATs) technology in account processing. On the other hand, this study reveals the mediating role of eXtensible Business Reporting Language (XBRL) between reducing those challenges and audit evidence. A questionnaire was distributed to the study population of legal and practicing auditors. The results of the study concluded that there was a positive impact of the effectiveness of reducing the challenges represented by (system's processing of information, retention of audit evidence, the internal control system, and the availability of hard copies) in the audit evidence. On the other hand, it has been proven that there was a positive effect of (XBRL) in the audit evidence in the presence of the mentioned procedures in reducing challenges.
Keywords
Competitiveness, Strategic Management, Industrial Park.
Introduction
In the context of development, industrial park have become synonymous with industrialization processes and are considered a powerful tool for job creation, economic growth and competitiveness (United Nations Industrial Development Organization, 1997). Industrial parks are currently a point of economic growth for the region and an attraction for direct investment in the region. The main competitive advantages of such locations for resident companies include the possibility of reducing time and financial costs for organizing production, favorable location in relation to transportation routes, markets for raw materials and finished goods, and targeted support for residents of industrial parks by state (Tikhanov et al., 2018).
The industrial park business in Indonesia has grown rapidly since its inception in the 1970s, but poor planning and weak policy implementation have led to policy problems in four main aspects: administrative inefficiency, poor infrastructure, antagonistic labor relations, and limited incentives. This problem is further exacerbated by problems such as rising labor costs and soaring land prices in Greater Jakarta and its surroundings, home to most of Indonesia's most prominent industrial parks (Octavia, 2016).
According to (UNIDO, 2019), a number of trends have shaped the future of industrial parks. First, the increase in the number of industrial parks since the early 1990s has created competition to attract investment and pressure to offer better services. Second, increasing urbanization and the growth of residential and multi-purpose areas within or adjacent to industrial parks have created pressure to better integrate them into the wider urban context. Third, better management of environmental externalities in recent years, particularly in the context of increasing awareness of climate change, has become an increasingly significant factor in business operations and decision-making for resource-efficient 'green growth' and 'circular economies' business models. Fourth, digital transformation, particularly in technology related to Industry 4.0, presents opportunities and challenges for companies that are actively embracing trends and striving to stay abreast of productivity gains.
The Government of Indonesia together with local governments continues to encourage the development of industrial parks in order to attract both domestic and foreign investors, and through the Minister of Industry Regulation No. 40 about Technical Guidelines for Industrial Parks which divides the development of industrial parks into the preparation stage, the development stage, and the management stage (Menteri Perindustrian RI, 2016). The government's goal prepares those guidelines so that industrial parks are built according to spatial planning, supported by infrastructure, efficient and environmentally friendly, so that in turn they are able to attract investment for industrial development and accelerate the spread and equitable distribution of industrial development.
The development of industrial parks involves careful planning and supervision. The principle stages in industrial park planning include: business case formulation, including pre-feasibility studies; pre-identification of a short list of suitable regional sites; detailed feasibility analysis of the selected site; and financial arrangements and agreements with financial backers (UNIDO, 2019).
Based on the explanation above, this study aims to investigate the problems and customer needs which are the basis for planning the development of industrial park, but the need to follow the established standards while creating a competitive advantage adds complexity to the formulation of industrial park development strategies.
Literature Review
Industrial Parks
Industrial parks are areas that are categorized and planned for the purpose of industrial development. In Government Regulation of the Republic of Indonesia No. 24 of 2009 about Industrial Parks states that industrial parks are areas where industrial activities are concentrated, equipped with supporting facilities and infrastructure developed and managed by industrial park companies that already have an industrial park business permit (Indonesia, 2009).
The general definition of an industrial park according to the United Nations Industrial Development Organization is a plot of land that is developed and divided into plots according to a comprehensive plan with the provision of roads, transportation and public utilities, sometimes also with public facilities, for use by a group of producers (UNIDO, 2019).
Another definition states that an industrial park is an area that is usually dominated by industrial activities and usually has facilities consisting of industrial plants, research and development laboratories, office buildings, banks, and other infrastructure such as social and public facilities that includes offices, housing, schools, places of worship, open spaces and others (Frej & Gause, 2001). Industrial parks are usually located on the edge or outside of the city's main residential areas, and feature easy accessibility of transportation, especially where more than one mode of transportation coincides, including roads, railroads, airports and ports.
According to Government Regulation of the Republic of Indonesia No. 24 of 2009 explains that the development of industrial park aims to control space utilization, increase efforts to develop environmentally friendly industries, accelerate industrial growth in the region, increase industrial and investment competitiveness, and provide location certainty in infrastructure planning and development, which is coordinated between related sectors (Indonesia, 2009).
Strategic Management
In the field of management, strategic management involves the formulation and implementation of key objectives and initiatives taken by organizational managers on behalf of stakeholders, based on resource considerations and an assessment of the internal and external environment in which the organization operates (Pfeffer & Salancik, 2015). Strategic management is the art and science of formulating, implementing, and evaluating cross-functional decisions that will enable an organization to achieve its goals. It is the highest level of managerial activity (Ayitey, 2010).
One of the early concepts of strategy defined strategy as the determination of the basic long-term goals of an enterprise, and the adoption of the actions and allocation of resources necessary to carry out those goals (Myers & Chandler, 1962). Strategy has been studied for years by business leaders and business theorists, some believe it is necessary to carefully analyze the present, anticipate changes in the market or industry, and, from this, plan how strategy will succeed in the future, while others think that the future is too difficult to predict, and prefer to develop strategies organically (Bukhari, 2019).
Strategy determines the direction and scope of the organization over the long term, and they say that it should define how resources should be configured to meet market and stakeholder needs (Johnson & Scholes, 2005). Another definition describes strategy as the way a company directs itself toward the markets in which it operates and toward other companies in the markets in which it competes. It is a plan that an organization formulates to gain a sustainable advantage over the competition (Ayitey, 2010).
In the end, every organization and company must have its own strategy to ensure that every activity and its business is the best step to face the competition and move towards achieving the company's main goals.
Strategy Analysis Tools
Swot matrix
In accordance with the systems approach, the organization is a whole that interacts with its environment and consists of various sub-systems. In this sense, the organization exists in two spheres, one within itself and the other outside. SWOT analysis is a tool used for strategic planning and strategic management in organizations. It can be used effectively to build organizational strategy and competitive strategy (Gürel, 2017).
SWOT analysis is a simple but powerful tool for measuring an organization's resource capabilities and deficiencies, its market opportunities, and external threats to its future. Internal analysis identifies the resources, capabilities, core competencies, and competitive advantages inherent in the organization. External analysis identifies market opportunities and threats by looking at competitors' resources, industry environment, and general environment (Sammut-Bonnici & Galea, 2015; Thompson et al., 2007).
General electric (g.e) matrix
General Electric (GE) analysis is a technique used in brand marketing and product management to help companies decide what products to add to their portfolios and which market opportunities they should continue to invest in. This analysis was first developed by McKinsey in the 1970s. The GE-McKinsey nine-box matrix is a strategy tool that offers a systematic approach for multi-business companies to prioritize their investments among their business units (McKinsey&Company, 2008).
This matrix uses two factors, the first factor is the attractiveness of the industry which shows how difficult or easy it is for the company to compete in the market and earn profits includes long-term growth rate, industry size, industry profitability, industry structure, product life cycle changes, demand changes, price trends, labor availability and market segmentation.
The second factor is the competitive power which is how strong, in terms of competition, a particular business unit is against its competitors which generally show the competitive strengths of a business unit include total market share, market share growth, brand strength, company profitability, customer loyalty, value chain strength, level of product differentiation, and production flexibility (McKinsey&Company, 2008).
Quantitative strategic planning matrix (qspm)
QSPM is the final stage matrix in strategy formulation, this technique clearly shows the best alternative strategy to choose (Purwanto, 2008). QSPM uses input from the analysis of internal and external factors and processing (IE Matrix and SWOT Matrix) for further analysis through QSPM.
This analysis is divided into 6 steps, the first step is to make a list of external opportunities/threats and the company's key internal strengths and weaknesses; the second step is to give weight to each internal and external factor; the third step is to match and identify alternative strategies that the organization must consider; the fourth step is to determine the Attractiveness Score (AS) which indicates the relative attractiveness of each strategy in a particular set of alternatives; the fifth step is to calculate the Total Attraction Score (TAS); and the sixth step is to reveal which strategy is the most attractive from each set of alternatives based on the TAS.
Quality function deployment (qfd)
QFD is a well-known quality management tool, originally created in 1966 by Akao which has been widely adopted but interpreted differently in the literature, which makes it difficult for managers to adopt this complex management tool. Akao explained that QFD is a method for developing quality designs aimed at satisfying customers and then translating customer demands into design targets and the main quality assurance during the production phase (Sharma et al., 2008).
Another definition states that QFD is an investment in people and information. It uses cross-functional teams to determine customer requirements. QFD is a systematic and analytical technique to meet customer expectations. QFD is the planning process for translating the voice of the customer into appropriate technical requirements for each stage of marketing strategy development, planning, product and engineering design, prototype evaluation, production process development, production, and sales (Zaim & ?evkli, 2002)
Conceptual Model
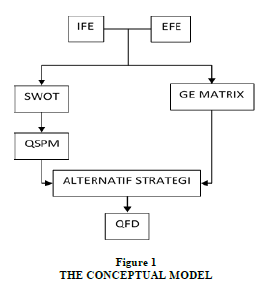
The formulation of the strategy was based on the concept of (David, 2010), who developed a comprehensive alternative strategy by analyzing the condition of industrial park internally and investigating the external environment. Next, develop a strategy using SWOT analysis and determine the positioning of the company and business units using the General Electric Matrix to determine the company's investment direction. Provide scores and weights to determine strategic priorities to be implemented with the QSPM method and relate them to customer desires, in this case, companies that are domiciled or operating in the Makassar Industrial Park through QFD analysis (Figure 1).
Research Method
Location and Research Design
This research is an explanatory research in the form of applied research that is descriptive (explanation without any hypothesis-test) that conducted at PT Kawasan Industri Makassar (KIMA) Persero which is located in Makassar City. A qualitative approach with a focus on analyzing alternative strategies in changing the company's environment and choosing the best alternative strategy to be implemented. Qualitative research uses structured, unstructured observation and communication interactions, especially in-depth interviews.
The data in this study are in the form of words, pictures and a few numbers which are analyzed in terms of individual responses, descriptive conclusions, or both. The findings in the study are unique, conclusions made are not to be generalized to the population. Conclusions can be transferred to certain situations whose characteristics are the same or relatively the same.
Population or Samples
The population in this study are companies that are customers of PT. KIMA. Determination of the sample in this study using purposive sampling technique. Purposive sampling is a sampling method that is carried out by selecting subjects based on specific criteria set by the researcher.
Data Collection Method
Data collection in this study was carried out in 3 (three) ways, namely literature study, field study, interviews and questionnaires.
Data Analysis Method
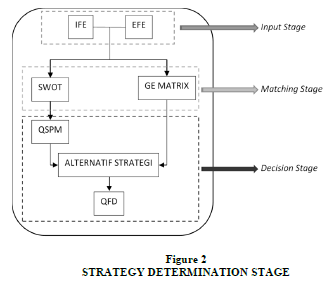
For the implementation of strategic management analysis, several methods are used according to company conditions based on Fred R. David's comprehensive management model, with the stages as shown in the following figure 2.
Empirial Results
Input Stage
After collecting basic information which is an important factor for the company both internally and externally as a basis in the stages of developing the company's strategy, the next step is to determine the weight and rating of each information. Based on the information obtained, the results of the calculation of IFE and EFE of the Makassar Industrial Park are shown in the Tables 1 & 2 below.
| Table 1 Internal Factor Evaluation Matrix | ||||
| Code | Statement Items | Weight | Rating | Score |
| S1 | Strategic industrial park location with access to highway connected to airport and seaport | 0.115 | 3.7 | 0.42 |
| S2 | Warehousing facilities, Ready-to-use Factory Buildings and other adequate supporting facilities | 0.104 | 3.3 | 0.34 |
| S3 | The available land is ready to build with a competitive selling price | 0.091 | 2.9 | 0.26 |
| S4 | High liquidity and solvency with priority use of own capital | 0.092 | 2.9 | 0.27 |
| S5 | Competent human resources in their field | 0.101 | 3.2 | 0.32 |
| S6 | High community development by maintaining good relations with relevant stakeholders | 0.112 | 3.6 | 0.40 |
| Total Score of Strengths Factor | 2.02 | |||
| W1 | Limited land for developing existing areas | 0.104 | 3.3 | 0.34 |
| W2 | Low promotional activity and dependence on investment climate | 0.092 | 2.9 | 0.27 |
| W3 | Knowledge and implementation of information technology is still low | 0.087 | 2.8 | 0.24 |
| W4 | The high cost of maintaining the area's facilities and infrastructure | 0.102 | 3.2 | 0.33 |
| Total Score of Weaknesses Factor | 1.18 | |||
| TOTAL SCORE | 1.000 | 3.20 | ||
| Table 2 External Factor Evaluation Matrix | ||||
| Code | Statement Items | Weight | Rating | Score |
| O1 | The opening of development opportunities in the Mamminasata Region | 0.126 | 3.6 | 0.45 |
| O2 | The government's commitment to support Makassar Industrial Park | 0.119 | 3.4 | 0.41 |
| O3 | The potential for foreign and domestic markets is quite large | 0.118 | 3.4 | 0.40 |
| O4 | The huge potential of natural resources (agriculture, fisheries, animal husbandry) in South Sulawesi | 0.106 | 3.0 | 0.32 |
| S5 | Synergy between State-owned Enterprises (BUMN) | 0.102 | 2.9 | 0.30 |
| Total Score of Opportunities Factor | 1.88 | |||
| T1 | Industrial permit outside Industrial Park granted but within industrial zone | 0.096 | 2.7 | 0.26 |
| T2 | Land prices for expansion areas are getting higher | 0.119 | 3.4 | 0.41 |
| T3 | Industrial zones and Integrated Economic Development Zones will be opened in the regencies of South Sulawesi Province | 0.091 | 2.6 | 0.24 |
| T4 | Economic contraction of South Sulawesi Province by 5% | 0.122 | 3.5 | 0.42 |
| Total Score of Threats Factor | 1.33 | |||
| TOTAL SCORE | 1.000 | 3.20 | ||
Matching Stage
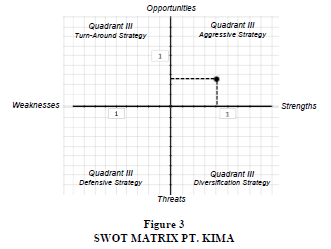
To determine the company's position in the SWOT quadrant, a comparison of the value of internal factors (strengths - weaknesses) is carried out to determine the point on the X axis and a comparison of the value of external factors (opportunities - threats) to determine the point on the Y axis with the following results (Figure 3):
Based on the results, PT. KIMA is in a position where it is necessary to take full advantage of all the advantages and opportunities that exist. The strategy that can be developed is a strategy that supports an aggressive growth policy, through the use of power to capture a large enough market opportunity. Taking this into account, the following combination strategy is formulated.
1. Strategy (S – O), Renovation of industrial park facilities with international standards to open opportunities for investors and companies from abroad and can help increase the export potential of products from South Sulawesi's natural resources
2. Strategy (S – T), Improving the image and professionalism as well as the strategic role of industrial parks to provide optimal service to customers or business partners.
3. Strategy (W – O), Development of industrial park in new areas with adequate land backup for future development.
4. Strategy (W – T), Making plans for facility development and mapping of business opportunities to become an industrial center in Eastern Indonesia.
The following is presented data on the Industry Attractiveness and the Competitive Strength of PT. KIMA Tables 3 & 4.
| Table 3 Industry Attractiveness Matrix (I. A.) | |||
| Factors | Weight | Rating | Score |
| Market Growth Rate | 19 | 0.87 | 16.53 |
| Market Size | 21 | 0.72 | 15.12 |
| Demand Variability | 8 | 0.56 | 4.48 |
| Industry Profitability | 22 | 0.69 | 15.18 |
| Industry Competition | 12 | 0.41 | 4.92 |
| Global Opportunity | 18 | 0.88 | 15.84 |
| Industry Attractiveness (I.A.) Index | 100 | 72.07 | |
| Table 4 Competitive Strength Matrix (C.S.) | |||
| Factors | Weight | Rating | Score |
| Market share | 20 | 0.68 | 13.60 |
| Market Share Growth | 10 | 0.55 | 5.50 |
| Brand Equity | 21 | 0.62 | 13.02 |
| Distribution Channel Access | 22 | 0.83 | 18.26 |
| Production capacity | 11 | 0.77 | 8.5 |
| Profit Margin | 16 | 0.80 | 12.8 |
| Competitive Strength (C.S.) Index | 100 | 72.07 | |
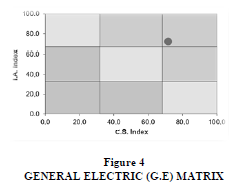
Based on the chart above, PT. KIMA is in a position that shows the possibility of a 'Grow, Invest and Build' strategy, which means the company has business opportunities to grow because it is located in a cell that has a large market appeal, with high priority income and has a competitive advantage in Figure 4.
Decision Stage
At this stage, an objective strategy is chosen based on the identified internal and external factors as well as the results of other analyzes. This stage is carried out with the aim of determining which strategy is considered the best to be implemented in Table 5.
| Table 5 Quantitative Strategic Planning Matrix (QSPM) PT. KIMA | |||||||||
| Code | Weight | Strategy SO | Strategi ST | Strategi WO | Strategi WT | ||||
| AS | TAS | AS | TAS | AS | TAS | AS | TAS | ||
| S1 | 0.115 | 3.40 | 0.39 | 3.60 | 0.42 | 3.00 | 0.35 | 3.40 | 0.39 |
| S2 | 0.104 | 3.80 | 0.39 | 3.40 | 0.35 | 3.00 | 0.31 | 2.80 | 0.29 |
| S3 | 0.091 | 3.20 | 0.29 | 3.00 | 0.27 | 2.60 | 0.24 | 3.00 | 0.27 |
| S4 | 0.092 | 2.40 | 0.22 | 2.20 | 0.20 | 3.20 | 0.30 | 2.60 | 0.24 |
| S5 | 0.101 | 2.80 | 0.28 | 3.20 | 0.32 | 2.60 | 0.26 | 3.40 | 0.34 |
| S6 | 0.112 | 3.60 | 0.40 | 3.00 | 0.34 | 3.40 | 0.38 | 3.00 | 0.34 |
| W1 | 0.104 | 2.80 | 0.29 | 2.40 | 0.25 | 4.00 | 0.42 | 3.80 | 0.39 |
| W2 | 0.092 | 2.60 | 0.24 | 3.40 | 0.31 | 2.80 | 0.26 | 3.20 | 0.30 |
| W3 | 0.087 | 3.40 | 0.30 | 3.60 | 0.31 | 2.40 | 0.21 | 2.40 | 0.21 |
| W4 | 0.102 | 3.00 | 0.31 | 3.20 | 0.33 | 3.00 | 0.31 | 2.60 | 0.26 |
| O1 | 0.126 | 2.80 | 0.35 | 2.80 | 0.35 | 4.00 | 0.51 | 3.40 | 0.43 |
| O2 | 0.119 | 3.00 | 0.36 | 2.40 | 0.29 | 3.40 | 0.41 | 3.00 | 0.36 |
| O3 | 0.118 | 3.60 | 0.43 | 3.00 | 0.35 | 3.00 | 0.35 | 3.60 | 0.43 |
| O4 | 0.106 | 3.40 | 0.36 | 2.20 | 0.23 | 3.60 | 0.38 | 3.20 | 0.34 |
| O5 | 0.102 | 2.40 | 0.24 | 3.00 | 0.31 | 2.40 | 0.21 | 2.80 | 0.28 |
| T1 | 0.096 | 2.60 | 0.25 | 2.60 | 0.25 | 2.20 | 0.21 | 2.60 | 0.25 |
| T1 | 0.119 | 3.40 | 0.41 | 2.40 | 0.29 | 3.60 | 0.43 | 3.00 | 0.36 |
| T3 | 0.091 | 2.60 | 0.24 | 3.00 | 0.27 | 3.20 | 0.29 | 2.40 | 0.22 |
| T4 | 0.122 | 2.80 | 0.34 | 3.00 | 0.36 | 3.20 | 0.39 | 3.60 | 0.44 |
| Total | 6.09 | 5.81 | 6.23 | 6.14 | |||||
Based on the test for the alternative strategies above, it shows that the strategy "Development of areas in new areas with adequate land backup for future development" has a Total Attractive Score (TAS) of 6,23 which is the highest score among other alternative strategies.
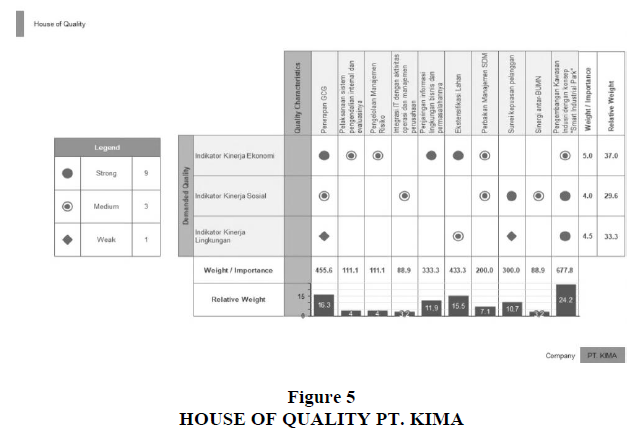
Carrying out a large investment requires careful design, therefore, by using the Quality Function Deployment (QFD) method using the existing performance of the Makassar Industrial Park based on Key Performance Indicators (KPIs) for Industrial Park (UNIDO, 2019) as Demanded Quality or “Whats”. Furthermore, it will be linked to the strategic plan of PT. KIMA as Quality Characteristics or “Hows”. The results are shown in the Figure 5 below.
Based on the results of the analysis above, it shows that the Industrial Pak Development strategy with the concept of "Smart Industrial Park" gets the highest relative weight. If it is related to the results of the previous analysis, it can be concluded that the strategy that needs to be implemented is "Development of a Smart Industrial Park in a new location".
Discussion
Through multiple analyzes concluded that the best strategy to be implemented for PT. KIMA is the development of industrial park in new locations using the "Smart" concept. This concept focuses on several aspects such as energy management, water and waste treatment systems, air conditioning systems, logistics efficiency, physical and data security, as well as the implementation of information technology systems.
The concept of “Smart” is similar to the concept of Eco-Industrial Parks or abbreviated as EIPs, which are industrial areas designed to improve the social, economic and environmental performance of the companies they live in, including through the promotion of symbiotic industries and green technologies that provide resource efficiency and generate income. competitive advantage, promote climate-resilient industries and value chains, as well as inclusive and sustainable business practices and socially responsible relationships with surrounding communities (UNIDO, 2019).
An eco-industrial park can be defined as a community of manufacturing and service businesses located together on common property. Its business members seek to improve environmental, economic and social performance through collaboration in managing environmental and resource issues (Lowe, 2001).
The benefits of EIP are not only commercial but also strategic, leading to reduced risk exposure, increased competitiveness, business development, production sustainability, and a better reputation with key stakeholders (UNIDO, 2017). It further explained that eco-industrial parks allow companies to benefit from greater collaboration and exchange within the company between management, technical and environmental staff, finance, etc.), as well as between companies, governments and service providers. Companies are collectively enabled to turn environmental problems into business solutions by using resources efficiently and working together through a shared infrastructure.
The main economic benefits of this Industrial Park are divided into 2. Direct benefits such as the creation of new jobs, cost savings due to reduced waste disposal, resource and energy consumption and increased competitiveness. Indirect benefits include indirect job creation through skills improvement and training, technology transfer, positive image, demonstration effect arising from best practice implementation, and local development.
The main environmental benefits are reduced pollution levels, more efficient use of resources (e.g. raw materials, water, energy), conservation and protection of biodiversity and nature, and reduction, reuse and recycling of waste. In addition, improved management of chemicals and hazardous substances in the area can yield significant environmental benefits.
The social benefits of developing this Industrial Park range from local job creation, better working and labor conditions, local community welfare and community outreach, increased gender equality, crime prevention and better security. It also often involves creating social infrastructure as well, which is especially important for developing countries.
The last and most significant benefit is that industrial park acts as drivers of business competitiveness. Industries operating within industrial park are in a better position to take advantage of the resource efficiency, value added actions and services available at the regional level.
References
- Ayitey, W.K. (2010). A Simple Approach to Strategic Management (A. H. O. Mensah (ed.); 1st ed.). Methodist Book Depot Ltd.
- Bukhari, S.A.R. (2019). What Is Strategy? https://doi.org/10.13140/RG.2.2.26435.35369
- David, F.R. (2010). Strategic Management: Consepts. Prentice Hall.
- Frej, A., & Gause, J.A. (2001). Business Park and Industrial Development Handbook (2nd ed.). Urban Land Institute.
- Gürel, E. (2017). SWOT ANALYSIS: A THEORETICAL REVIEW. The Journal of International Social Research, 10(51). https://doi.org/10.17719/jisr.2017.1832
- Indonesia, R. (2009). Peraturan Pemerintah No. 24 tentang Kawasan Industri.
- Johnson, G., & Scholes, K. (2005). Exploring Corporate Strategy (7th ed.). Prentice Hall.
- Lowe, E.A. (2001). Eco-industrial handbook for Asian developing countries. Report to the Environment Department, Asian Development Bank, July, 1–312.
- McKinsey & Company. (2008). Enduring Ideas: The GE–McKinsey nine-box matrix | McKinsey & Company. In 01.09.2008.
- Menteri Perindustrian RI. (2016). Peraturan Menteri Perindustrian No. 40 tentang Pedoman Teknis Pembangunan Kawasan Industri.
- Myers, K.H., & Chandler, A.D. (1962). Strategy and Structure: Chapters in the History of the Industrial Enterprise. The Mississippi Valley Historical Review. https://doi.org/10.2307/1902596
- Octavia, J. (2016). Rebuilding Indonesia’s Industrial Estates. Policy Brief, 01(1), 1–14.
- Pfeffer, J., & Salancik, G. (2015). External control of organizations-resource dependence perspective. In Organizational Behavior 2: Essential Theories of Process and Structure. https://doi.org/10.4324/9781315702001-32
- Purwanto, I. (2008). Manajemen Strategi. CV Ryama Widya.
- Sammut-Bonnici, T., & Galea, D. (2015). SWOT Analysis. In P. S. C. L. Cooper (Ed.), Wiley Encyclopedia of Management (Vol. 12). John Wiley & Sons, Ltd. https://doi.org/10.1002/9781118785317.weom120103
- Sharma, J.R., Rawani, A.M., & Barahate, M. (2008). Quality function deployment: a comprehensive literature review. International Journal of Data Analysis Techniques and Strategies. https://doi.org/10.1504/IJDATS.2008.020024
- Thompson, A.A.J., Strickland, A.J.I., & Gamble, J.E. (2007). Crafting & Executing Strategy (15th ed.). McGraw-Hill Irwin.
- Tikhanov, E.A., Krivorotov, V.V., Chepur, P.V., Tarasenko, A.A., & Gruchenkova, A.A. (2018). A complex of factors of increasing the competitiveness of industrial park residents. MATEC Web of Conferences, 193, 1–6. https://doi.org/10.1051/matecconf/201819305076
- UNIDO. (2017). Handbook for eco-industrial parks. 95. https://www.unido.org/sites/default/files/files/2019-10/UNIDO Eco-Industrial Park Handbook_English.pdf
- UNIDO. (2019). International Guidelines For Industrial Parks. Inclusive and Sustainable Industrial Development, 1–66.
- United Nations Industrial Development Organization. (1997). Industrial Estates: Principles and Practices.
- Zaim, S., & Sevkli, M. (2002). The Methodology of Quality Function Deployment with Crisp and Fuzzy Approaches and an Application in the Turkish Shampoo Industry. Journal of Economic & Social Research.
