Research Article: 2023 Vol: 27 Issue: 6
Brand Love Research: A Bibliometric Review
Saradhi Gonela, Symbiosis International University
Ramkrishna Dikkatwar, Pune Institute of Business Management, Pune, Maharashtra
Citation Information: Saradhi, G., & Dikkatwar, R. (2023). Brand love research: a bibliometric review. Academy of Marketing Studies Journal, 27(6), 1-14.
Abstract
Brand Love is described as a strong emotional connect a satisfied consumer has towards a particular brand (Carroll and Ahuvia, 2006; Kalyoncuo─?lu, 2017). Kevin Roberts’ (2004) work ‘Lovemarks: The Future Beyond Brands’, had intensified academic research on brand love. Further many authors have further explored and examined various dimensions of brand love Brand Love, for instance Batra et al. (2012) described seven dimensions of brand love. Similarly, Fournier (1998) observed hat brand love turns loyal customers into advocates or influencers. Further, Carroll and Ahuvia (2006) concluded that brand love is associated with positive word of mouth and brand loyalty. However, Polat and Çetinsöz (2021) object that little research has been carried out in this area. Taking the que from their work, this study aims to explore research in the area of Brand Love with four research questions through a structured bibliometric analysis to figure any commonalities (Pritchard, 1969 and Broadus, 1987). Articles for bibliometric analysis are sourced from Scopus, which reveals 379 documents published between 2006 and 2022. It is observed that this topic garnered traction among researchers from 2014-2015. Bagozzi R.P. and Batra R are that most influential authors with highest citation per document as they have 328.6 citations per document, along with Wallace E and Ahuvia A, Fetscherin M., Kaufmann H.R., Sarkar A., Loureiro S.M.C., Rauschnabel P.A., and Rauschnabel P.A. Two dimensions of brand love are studied: one dimension dealing with the customers’ emotions after using the brand with words. The second dimension is related to the customer attitude towards the brand.
Keywords
Brand Love, Brand Attitude, Brand Equity, Brand Satisfaction, Perceived Brand Value, Customer Engagement and Loyalty.
Introduction
Brand Love is a strong emotional connect a satisfied consumer has towards a particular brand (Carroll and Ahuvia, 2006; Kalyoncuo?lu, 2017). Consumer and brand relationships have long been evaluated through passionate and emotional feelings of consumers. Consumers’ likes-dislikes has been engaging researchers and practitioners alike (Bergkvist and Larsen, 2010). Kevin Roberts’ (2004) work ‘Lovemarks: The Future Beyond Brands’, had intensified academic research on brand love. Bauer, Heinrich, and Albrecht (2009) opined that consumer tend to forgive brands for brand failures. Consumers compare each brand against its competitors to determine the best among the lot to develop love for the best brand (Keller, 2003; Belaid & Temessek Behi, 2011; Junaid et al., 2019). Many researchers defined brand love as consumers’ intense and positive emotional attachment dominating customer cognition (Patwardhan & Balasubramanian, 2011; Cho & Hwang, 2020). This definition of brand love underlines cognitive and emotional facets of consumers while studding brand love.
Thomson MacInnis, and Park (2005); Albert, Merunka, and Valette-Florence (2008) have studied the constructs of brand love. Batra et al. (2012) described seven dimensions of brand love: (1) Passion-driven behaviour, (2) Self-brand integration, (3) Positive emotional connection, (4) Anticipated separation distress, (5) Attitude valence, (6) Attitude strength, (7) Long-term relationship. Further, (1) Passion-driven behavior, (2) Self- brand integration, (3) Positive emotional connection, (4) Anticipated separation distress, (5) Attitude valence, (6) Attitude strength, (7) Long-term relationship.
Several studies explored the role of brand love in consumer behaviour. Bergkvist and Bech-Larsen, (2010); Roy S.K., Eshghi A., Sarkar A., (2013); Ayd?n (2017) studied the intermediary role that brand love plays on self-image congruence on brand commitment, brand awareness and consumer trust. A?k?n & ?pek (2016) assessed the intermediary effect of brand love in building a correlation between brand experience and brand loyalty. Many studies suggest that brand love results in brand loyalty (Bergkvist and Bech-Larsen, 2010; Albert and Merunka, 2013; Aro et al., 2018). Brand love turns loyal customers into advocates or influencers of the brand (Fournier (1998); Carroll and Ahuvia (2006) concluded that brand love is associated with positive word of mouth and brand loyalty.
Although this kind of interest may suggest that brand love is one of the most researched topics in marketing, Polat and Çetinsöz (2021) object that little research has been carried out in this area. This study is aimed at bibliometric analysis of Brand Love research in marketing with the following research questions (RQ):
RQ1. Who are the prominent authors along with journals in the field of Brand Love research?
RQ2. What are the key themes in Brand Love research?
RQ3. What are the major semantic clusters in Brand Love research?
RQ4. What are the future research topics/questions in Brand Love domains?
In the next section (i.e., Section 2) theoretical foundations of bibliometric studies and methodology are presented followed by a Section 3 that discusses the results of descriptive method presenting the major publications in Brand Love, prominent authors, journals, institutions and geographic regions. In Section 4, citation analysis is presented to identify relationships among publications, authors and journals. Finally, in Section 5 cluster themes are identified and discussed along with providing the scope of future research.
Methodology and Data
For a long time, researchers have employed several approaches to analyse multiple ways of possible intellectual convergence of the published document of a journal, a topic or authors (Kessler, 1963). For instance, if two studies were to be cited in a third study, it can be concluded that the three studies have intellectual and/or conceptual commonality (Small, 1973). Similarly, presence of keywords among several or many documents indicate commonality in conceptual and/or knowledge structure of the documents (Callon et al., 1983). Further, co-authorship shows authorship patterns and intellectual and/or knowledge commonality among the collaborating authors (Peters and Van Raan, 1991; Koseoglu, 2016). Not limited to these, convergence is possible in common themes, co-occurrence of key words, sources, referencing patterns or any other commonality among the published studies including universities and countries. One of the popular approaches to study such convergence has been bibliometric analysis. Bibliometric analysis is a field of library sciences that analyse large volumes of published material through quantitative methods to explore any commonalities (Pritchard, 1969 and Broadus, 1987).
Before the advent of digital capabilities, such as computing and internet, bibliometric analysis was manual requiring physical studying of documents demanding time and energy. That the documents are available online is helping researchers by enabling digital interventions in studying the documents for convergence. Also, availability of various software packages exclusively for bibliometric analysis provide a holistic view of a given topic to the researchers. Bibliometric studies classify bibliographic material by framing representative summaries of the literature.
Drawing from the above scholars, this study presents a bibliometric overview of ‘Brand Love’ in both descriptive and network analyses. The descriptive analyses include the total number of publications, citations, and citations per publication. This study concentrates on the total number of publications and citations between 2006 and 2022 mainly extracted from the Scopus database for bibliometric analysis.
Apart from the descriptive analyses, this study carries out network analyses including bibliographic couplings, co-citations, and co-occurrences. Following Van Eck and Waltman (2018), this study uses VOSviewer software to graphically map the bibliographic coupling of countries, co-citations, and co-occurrence of keywords and authors. VOSviewer uses two standardized weights, a) the number of and b) total strength of the links, to graphically visualize the nodal network. The size of the nodes and the interlinking lines connecting the nodes denote the relevance and strength of the links.
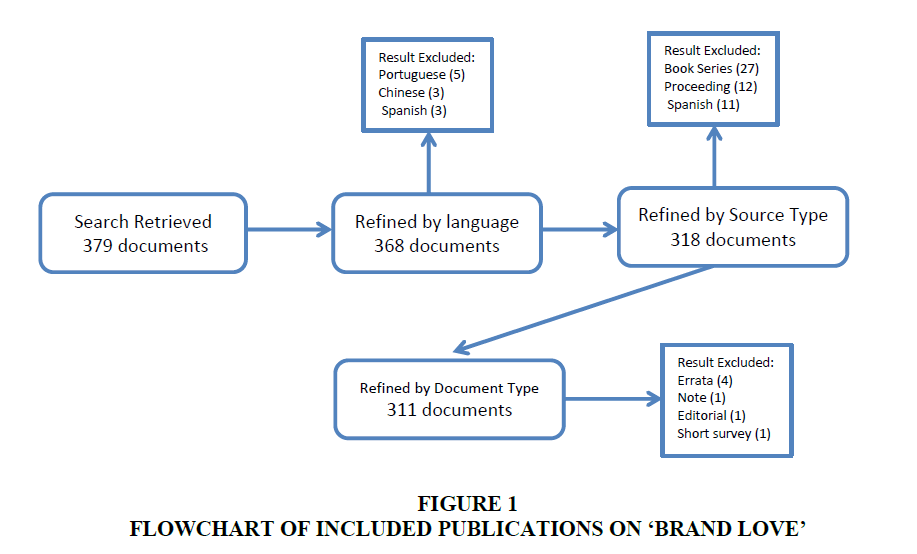
Bibliographic data for this study has been sourced from the Scopus database, the largest multi-disciplinary database of peer-reviewed literature in social science research (--). Scopus database was introduced by Elsevier in 2004, hosting more academic articles compared other databases (Veloutsou and Ruiz-Mafe, 2020). On brand love, Scopus reveals 379 documents published between 2006 and 2022, with ‘brand love’ either in the title or indicated as a keyword. These documents include 307 articles and other academic documents as indicated in flowchart, Figure 1.
At the end 311 documents were considered for analysis. The description of these 311 documents offered in Table 1.
| Table 1 Discreption Of Retrivals |
||
|---|---|---|
| Characteristics of Publication | Number of Publications | |
| Document Type | Article | 300 |
| Review | 8 | |
| Conference paper | 3 | |
| Publication Stage | Final | 291 |
| In press | 20 | |
| Subject Area | Business, Management and Accounting | 256 |
| Social Sciences | 64 | |
| Economics, Econometrics and Finance | 48 | |
| Psychology | 22 | |
| Computer Science | 17 | |
| Arts and Humanities | 14 | |
Results and Discussions
In this section, the first research questions, i.e. who are the dominant authors, and journals, contributing to the Brand love research, has been answered.
As any researcher on the topic Brand Love would assume, majority of the documents are from the management domain and are acamedic reasearch. However, as the topic can have multiple dimensions involving other fields, some interest has been shown by the other areas also of which economics leading the pack. The topic garnered traction among researchers from 2014-2015 as is evident fromTable 2. Understandably, till that time not many were working on the topic. This pattern is typical for any new topic.
| Table 2 Year Wise Trend Of Publications |
|||
|---|---|---|---|
| Year | Number of Documents | Year | Number of Documents |
| 2006 | 1 | 2016 | 18 |
| 2008 | 1 | 2017 | 12 |
| 2009 | 1 | 2018 | 26 |
| 2010 | 1 | 2019 | 46 |
| 2012 | 7 | 2020 | 52 |
| 2013 | 3 | 2021 | 72 |
| 2014 | 11 | 2022* | 45 |
| 2015 | 15 | ||
*Documents published till May 2022, as this study begun in June 2022.
Influential Authors
Citation is agreed to be a proxy for quality of the research indicating usefulness accuracy and importance of a specific article (Narin 1976; Martin and Irvine 1983; Aksnes, Langfeldt, and Wouters, 2019). However, comparing bare citations would be misleading as the year of publication, citation practices and field specific attributes would influence citation strength of a given research work (Kreiman and Maunsell 2011; Opthof 2011; Crespo, et al. 2013). Thus, citation normalisation has been widely used in the bibliometric analysis to achieve comparability across fields and years (Ioannidis, Boyack, & Wouters, 2016; Hicks et al. 2015). Table 3 presents the top most cited authors of Brand Love. Dhir A and Talwar S, feature in the first two slots as they have highest normalised citation of 23.1, however, Ahuiva A is the highest cited author with of 1005 citations. Bagozzi R.P. and Batra R have the highest citation per document as they have 328.6 citations per document, while Wallace E and Ahuvia A have more than 100 citations per document. Fetscherin M., Kaufmann H.R., Sarkar A., Loureiro S.M.C., Rauschnabel P.A., Rauschnabel P.A. have more than 100 citations making them also influential authors of Brand Love.
| Table 3 Most Influential Authors* Of Brand Love |
||||||||
|---|---|---|---|---|---|---|---|---|
| Sr. No. | Name Of Author | Links | Total Link Strength | Documents | Citations | Normalized Citation | TP/TC | Avg. Norm. Citations |
| 1 | Dhir A. | 3 | 5 | 5 | 108 | 23.13 | 21.6 | 4.63 |
| 2 | Talwar S. | 3 | 5 | 5 | 108 | 23.13 | 21.6 | 4.63 |
| 3 | Kaur P. | 3 | 4 | 4 | 89 | 19.61 | 22.25 | 4.9 |
| 4 | Kumar S. | 3 | 3 | 3 | 86 | 15.96 | 28.67 | 5.32 |
| 5 | Ahuvia A. | 3 | 5 | 6 | 1005 | 10.63 | 167.5 | 1.77 |
| 6 | Joshi R. | 1 | 1 | 3 | 41 | 10.43 | 13.67 | 3.48 |
| 7 | Hussain K. | 2 | 7 | 8 | 103 | 9.7 | 12.88 | 1.21 |
| 8 | Coelho A. | 0 | 0 | 3 | 170 | 9.38 | 56.67 | 3.13 |
| 9 | Wallace E. | 0 | 0 | 3 | 322 | 8.9 | 107.33 | 2.97 |
| 10 | Bagozzi R.P. | 2 | 3 | 3 | 986 | 7.29 | 328.67 | 2.43 |
| 11 | Batra R. | 2 | 3 | 3 | 986 | 7.29 | 328.67 | 2.43 |
| 12 | Rauschnabel P.A. | 1 | 2 | 4 | 251 | 6.45 | 62.75 | 1.61 |
| 13 | Loureiro S.M.C. | 1 | 3 | 6 | 294 | 6.33 | 49 | 1.06 |
| 14 | Hou F. | 2 | 7 | 7 | 84 | 6.18 | 12 | 0.88 |
| 15 | Junaid M. | 2 | 7 | 7 | 84 | 6.18 | 12 | 0.88 |
| 16 | Han H. | 0 | 0 | 6 | 54 | 5.68 | 9 | 0.95 |
| 17 | Sarkar A. | 3 | 9 | 10 | 239 | 5.55 | 23.9 | 0.56 |
| 18 | Wang Y.-C. | 1 | 2 | 5 | 78 | 5.28 | 15.6 | 1.06 |
| 19 | Rodrigues P. | 1 | 3 | 6 | 72 | 4.79 | 12 | 0.8 |
| 20 | Kaufmann H.R. | 1 | 3 | 6 | 192 | 4.46 | 32 | 0.74 |
| 21 | Sarkar J.G. | 2 | 7 | 7 | 47 | 3.25 | 6.71 | 0.46 |
| 22 | Yang J. | 1 | 2 | 3 | 32 | 3.19 | 10.67 | 1.06 |
| 23 | Sreejesh S. | 2 | 3 | 3 | 88 | 2.24 | 29.33 | 0.75 |
| 24 | Fetscherin M. | 0 | 0 | 3 | 127 | 2.19 | 42.33 | 0.73 |
| 25 | Roy S.K. | 1 | 1 | 4 | 96 | 2.16 | 24 | 0.54 |
| 26 | Bajpai N. | 2 | 3 | 3 | 10 | 1.86 | 3.33 | 0.62 |
| 27 | Kulshreshtha K. | 2 | 3 | 3 | 10 | 1.86 | 3.33 | 0.62 |
| 28 | Singh D. | 2 | 3 | 3 | 10 | 1.86 | 3.33 | 0.62 |
| 29 | Mittal A. | 1 | 1 | 3 | 56 | 1.4 | 18.67 | 0.47 |
| 30 | Biswas S. | 2 | 3 | 3 | 37 | 1.23 | 12.33 | 0.41 |
| 31 | Garg R. | 2 | 3 | 3 | 37 | 1.23 | 12.33 | 0.41 |
| 32 | Mukherjee J. | 2 | 3 | 3 | 37 | 1.23 | 12.33 | 0.41 |
| 33 | Pinto Borges A. | 1 | 3 | 3 | 9 | 0.85 | 3 | 0.28 |
| 34 | Madadi R. | 2 | 3 | 3 | 4 | 0.74 | 1.33 | 0.25 |
| 35 | Torres I.M. | 2 | 3 | 3 | 4 | 0.74 | 1.33 | 0.25 |
| 36 | Zúñiga M.Á. | 2 | 3 | 3 | 4 | 0.74 | 1.33 | 0.25 |
| 37 | Moussa S. | 0 | 0 | 3 | 17 | 0.69 | 5.67 | 0.23 |
| 38 | Yadav R. | 2 | 2 | 3 | 5 | 0.66 | 1.67 | 0.22 |
| 39 | Le M.T.H. | 0 | 0 | 3 | 2 | 0.24 | 0.67 | 0.08 |
| * Authors with a minimum of three documents. | ||||||||
Network Analysis
Bibliometric analysis results in three types of networks: collaboration networks, semantic networks and citation networks (Kessler 1963; Egghe and Rousseau 1990 and Sen and Gan 1983). Collaboration networks reveal collaborations between authors and/or institutions. Depicted as maps, collaboration network, show how authors have been working together. The relation is shown in form of clusters. Semantic networks (also known as word co-occurrence networks), also depicted as maps, show the connections among words that usually co-occur in titles, abstracts or keywords. These maps provide insights into the diverse research areas are interrelated. The citation networks, as name suggest, demonstrate relationships among academic documents depending on citations among those documents. Citation networks show the relationships in three ways direct citation (documents that cite one another); co-citation (all the articles cited in any given publication); and bibliographic coupling results when two studies cite same publications (Griffith, et al, 1974; Small & Griffith, 1974; Small & Sweeney, 1985;; and Boyack and Klavans 2010). The number of times citations are shared by two independent articles defines bibliographic coupling strength, i.e., the more citations shared by the two target documents the higher will be coupling strength (Kessler, 1963a; Vladutz and Cook, 1984). Coupling strength indicates semantic similarity between two articles (Kessler, 1963a; Ahlgren & Colliander, 2009). This model has been summarized as “A detailed representation of the structure and content of the international research front based on the strongly shared patterns of referencing among the current scientific literature papers” (Franklin & Johnston, 1988).
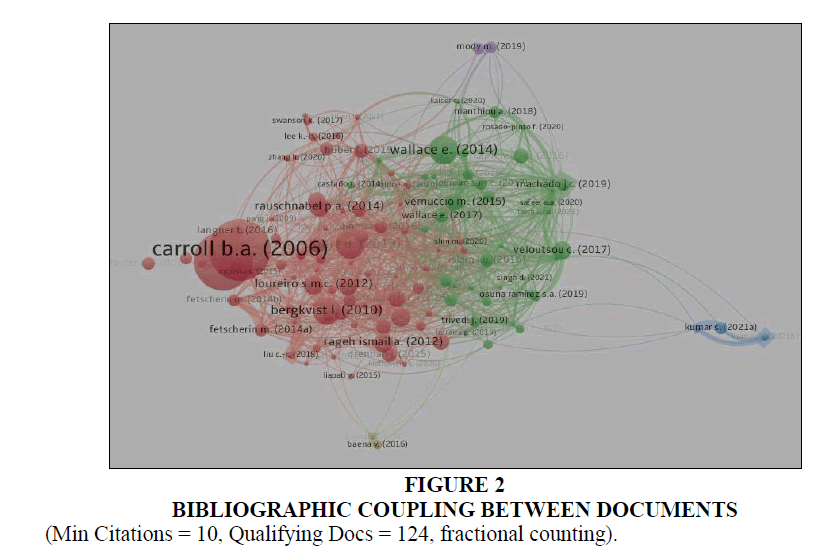
In Figure 2, we can see the bibliographic coupling between documents. We find five clusters of which two are prominent. The red cluster’s average citation is 70 and the green’s average citation is 39, indicating that the articles in cluster red share a very high semantic similarity compared to the articles in green cluster. Upon observing we found that most of the articles in red cluster are Conceptual Studies and most of the articles in green cluster are from the Journal of Product & Brand Management and that these articles share studies connected to internet. In the red cluster most prominent articles are of Carroll B.A., Ahuvia A.C. (2006), Batra R., et al (2012), Albert N., Merunka D. (2013) and Bergkvist L. (2010). In the green cluster most prominent articles are of Wallace E., Buil I., de Chernatony L. (2014), Veloutsou C., Guzmán F. (2017), Vernuccio M., et al (2015) and Kapferer J.-N., Valette-Florence P. (2016).
Figure 2: Bibliographic Coupling Between Documents.
(Min Citations = 10, Qualifying Docs = 124, fractional counting).
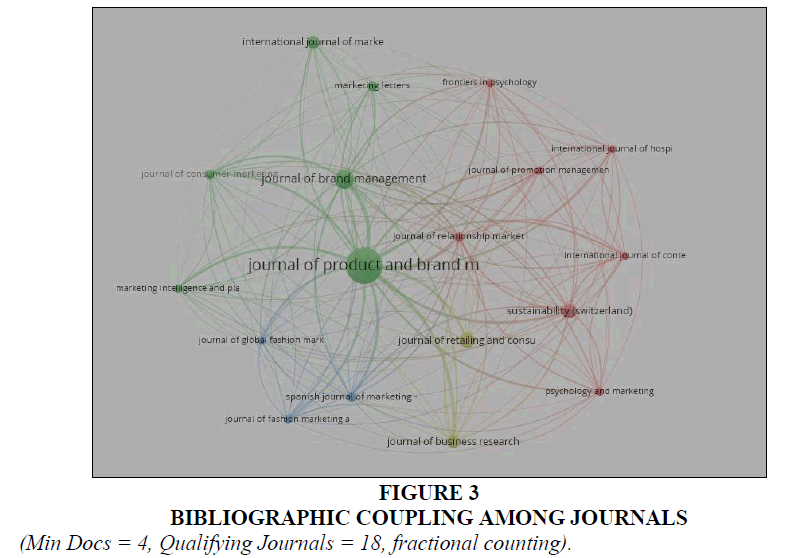
Figure 3 provides insights into the coupling of journals, giving a cue on the most prominent journals on one hand and also their connections on the other. Journals related to product and brand management show a strong copulation as is evident in the green cluster with Journal of Product and Brand Management as the most prominent along with Journal of Consumer Marketing, Journal of Brand Management, Marketing Intelligence and Planning along with others.
Figure 3: Bibliographic Coupling Among Journals.
(Min Docs = 4, Qualifying Journals = 18, fractional counting).
Brand management allied journals form another cluster with significant coupling. In the red cluster Frontiers in Psychology, International Journal of Contemporary Hospitality Management, International Journal of Hospitality Management, Journal of Promotion Management, Sustainability (Switzerland), Journal of Relationship Marketing and Psychology and Marketing are the prominent journals. Journals related to fashion management have a considerable coupling as seen in the blue cluster and the journals related to marketing research form another cluster.
Semantic Clusters
Keywords and key phrases semantically represented the contents of the article, thus, when two documents share common keywords and key phrases it can be concluded that the documents share the content. In other words, by analysing the similarity of keywords and phrases, the similarity of the content can be concluded. Keywords can be extracted using digital text processing methods or manually by experts. Keywords and phrases can also be extracted in clusters and the methods are called cluster-based methods. In these methods, keywords from various documents are extracted in clusters, based on semantic relatedness using co-occurrence similarity measures and select phrases that contain one or more cluster centroids. The keywords or key phrases that commonly co-occur will be clustered, confirming a pattern in which these keywords cooccur.
Relevance of two documents will be determined by similarity measurement criteria and the representatives of the documents (Dubes, & Jain 1980); Can, F., and E. A. Ozkarahan 1989; Frakes, W. B. and R. Baeza-Yates 1992]. The representatives of a document, also called cluster, are the document vectors that consist of <term, weight> pairs and similarities among documents is determined by the terms and their weight values. These are extracted from the document [Perry, S. A., and Willett P. 1983; Willett, P 1980]. Document vectors are obtained by term frequency (TF) and the inverted document frequency (IDF). Document are clustered by calculating TF-IDF (Murtagh, 1984; Sibson, 1973).
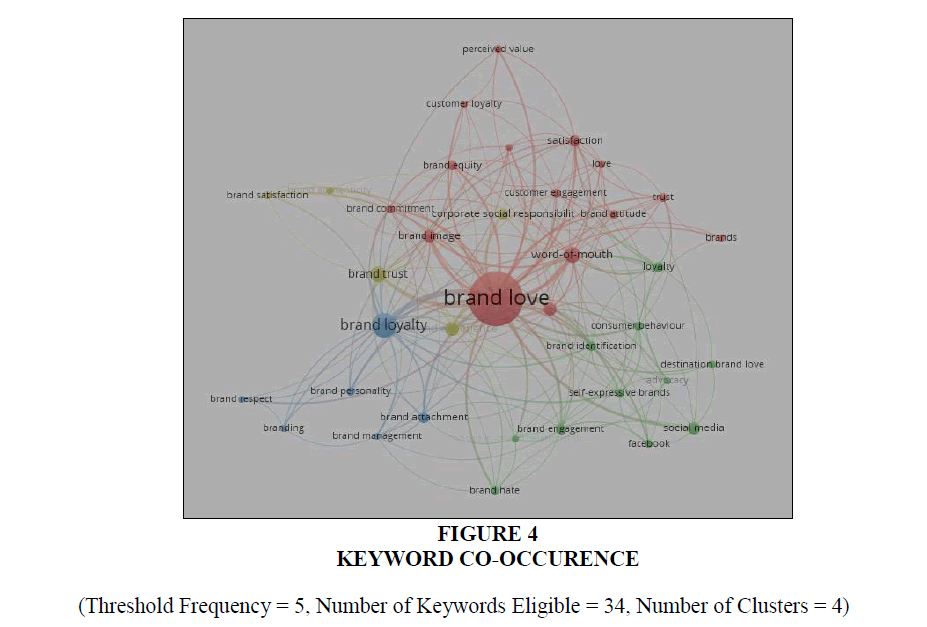
Figure 4, provides four clusters presenting the keywords that co-occur frequently.
Figure 4: Keyword Co-Occurence.
(Threshold Frequency = 5, Number of Keywords Eligible = 34, Number of Clusters = 4)
In the first cluster, the keywords represent two dimensions of brand love: one dimension dealing with the customers’ emotions after using the brand with words such as Satisfaction, Trust, Word-Of-Mouth, Perceived Value, Customer Engagement, Customer Loyalty and Love. The second dimension is related to the customer attitude towards the brand with the words such as Brand Attitude, Brand Commitment, Brand Equity, Brand Image, Brand Love, Consumer-Brand Relationships and Purchase Intention. The second dimension is dependent on the first dimension, meaning that these two dimensions cannot be separated and thus these two dimensions form a single cluster.
In the second cluster we find keywords related to customer becoming the brand advocate, thus we find keywords such as Advocacy, Brand Engagement, Brand Hate, Brand Identification, Consumer Behaviour, Consumer-Brand Relationship, Destination Brand Love, Facebook, Loyalty, Self-Expressive Brands and social media. Appearance of Facebook and social media indicate that the customers are depending on social media for advocating the brand to other (potential) customers.
The third cluster relates to the emotions of consumers towards the brand and the keywords are Brand Attachment, Brand Loyalty, Brand Management, Brand Personality, Brand Respect and Branding. Companies usually take these inputs for making brand related decisions, thus, the presence of keywords brand management and branding. The fourth cluster consists of keywords such as Brand Authenticity, Brand Experience, Brand Satisfaction, Brand Trust and Corporate Social Responsibility. These keywords are related to the customers’ experience with the brand.
In all 37 keywords are present in the chart and the largest node in the chat is that of ‘Brand Love’, also this node is connected to all the keywords in the signifying the collaboration of all the keywords in the chart to result in brand love in the minds of customers. Brand Love has strong connections with keywords such as perceived value, brand image, social media, brand loyalty and satisfaction indicating that these are the strong influences on brand love.
Citation Networks
Author co-citations analysis (ACA) was introduced by White & Griffith (1981) and since then it has become an integral part of bibliometric analysis. This analysis takes into account the frequency at which an author is co-cited with another author in the literature (Bayer, Smart, & McLaughlin, 1990). Using this frequency, intellectual structure of an academic discipline is identified, traced, and visualized. Intellectual structure of a specific domain is represented by groupings formed by accumulated co-citation trails in the literature. To accomplish this analysis, authors have to selected to begin with, then retrieve co-citation frequencies, depending on the frequencies create a correlation matrix, finally multivariate analysis is applied of the correlation matrix before the results are interpreted and validated (McCain, 1990).
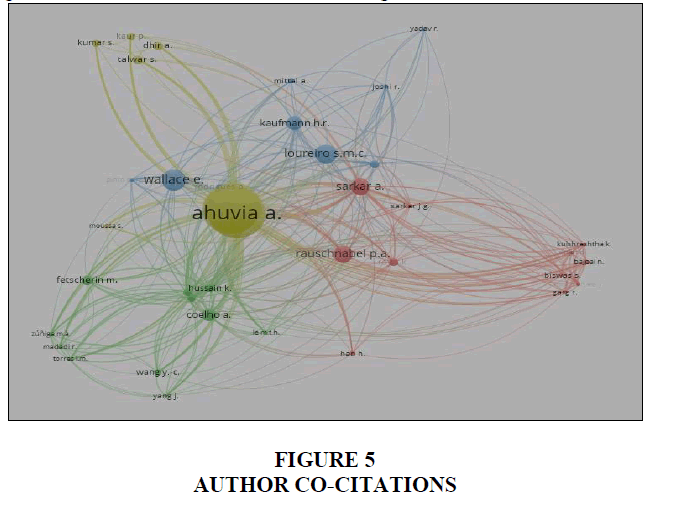
Figure 5 depicts the author co-citations analysis of Brand Love, with four clusters. The first cluster, coloured red, has 11 authors with Rauschnabel P.A., Sarkar A. and Roy S.K. as the major authors. It means, that these authors have worked on similar concepts in Brand Love. The second cluster, coloured green, has 11 authors with Coelho A., Fetscherin M. and Hussain K. as major authors. The following cluster is coloured blue has 9 authors with Wallace E., Loureiro S.M.C., and Kaufmann H.R., as major authors. The last cluster is coloured yellow has 9 authors with Ahuvia A., Bagozzi R.P. and Batra R. as major authors. The yellow cluster has the highest Average Co-Citation (Normalized) with a value of 3.9, and has the highest Average Total Link strength of 93.12. The blue cluster has Average Co-Citation (Normalized) of 1.2 and has the lowest of Average Total Link strength of 41.9. The green cluster has the Average Co-Citation (Normalized) of o.9, and has the Average Total Link strength of 62.6. Red cluster has the least Average Co-citation (normalised) of 0.65.
The articles such as Carroll & Ahuvia (2006); Batra et al (2012), Albert & Merunka (2013), Wallace et al. (2014); Bergkvist L. (2010) were the most influential works in the Brand love domain as evident from Table 4.
| Table 4 Articles With Highest Citations |
||||||
|---|---|---|---|---|---|---|
| Sr. No. | Publication | Total Citations Received | Sr. No. | Publication | Total Citations Received | |
| 1 | Carroll B.A., Ahuvia A.C. (2006) | 952 | 9 | Loureiro S.M.C., Ruediger K.H., Demetris V. (2012). | 119 | |
| 2 | Batra R., et al (2012) | 853 | 10 | Karjaluoto H., Munnukka J., Kiuru K. (2016) | 117 | |
| 3 | Albert N., Merunka D. (2013) | 260 | 11 | Veloutsou C., Guzmán F. (2017) | 110 | |
| 4 | Wallace E., Buil I., de Chernatony L. (2014) | 250 | 12 | Bagozzi R.P., Batra R., Ahuvia A. (2017) | 105 | |
| 5 | Bergkvist L. (2010) | 239 | 13 | Kaufmann H.R., Loureiro S.M.C., Manarioti A. (2016) | 102 | |
| 6 | Rauschnabel P.A., Ahuvia A.C. (2014) | 132 | 14 | Vernuccio M., et al (2015) | 101 | |
| 7 | Rageh Ismail A., Spinelli G. (2012) | 121 | 15 | Rauschnabel P.A., Krey N., Babin B.J., Ivens B.S. (2016) | 101 | |
| 8 | Huang C.-C. (2017) | 120 | ||||
Source: Articles with a minimum of 100 citations.
Countries with High Contributions
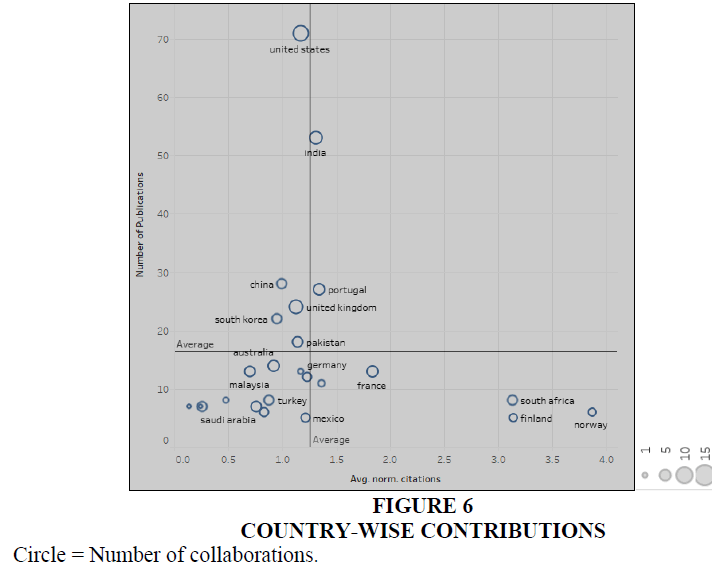
As evident from Chart 3.5, United States is the biggest contributor to the studies on Brand Love, followed by India. However, in terms of citations both these countries are hovering near average with countries such as Norway, South Africa and Finland leading on this parameter, even though these countries have less than average number of publications. This may be because the most cited authors are from these countries i.e., may be the seminal works in Brand Love originated from these countries Figure 6.
Conclusion And Agenda For Further Research
Several studies explored the role of brand love in consumer behaviour. The topic garnered traction among researchers from 2014-2015. Dhir A and Talwar S, have highest normalised citation of 23.1, however, Ahuiva A is the highest cited author with of 1005 citations. Bagozzi R.P. and Batra R have the highest citation per document as they have 328.6 citations per document, while Wallace E and Ahuvia A have more than 100 citations per document. Bibliographic coupling provides five clusters of which two are prominent. The most prominent articles, in the first cluster, are of Carroll B.A., Ahuvia A.C. (2006), Batra R., et al (2012), Albert N., Merunka D. (2013) (2013) and Bergkvist L. (2010). In the second cluster most prominent articles are of Wallace E., Buil I., de Chernatony L. (2014), Veloutsou C., Guzmán F. (2017), Vernuccio M., et al (2015) and Kapferer J.-N., Valette-Florence P. (2016). Journal of Product & Brand Management is the most important journal for Brand Love research along with along with Journal of Consumer Marketing, Journal of Brand Management, Marketing Intelligence. The keyword analysis provides four clusters presenting the keywords that co-occur frequently. One cluster deals with the customers’ emotions after using the brand with words such as Satisfaction, while second dimension is related to the customer attitude towards the brand with the words such as Brand Attitude. The third cluster relates to the emotions of consumers towards the brand and the keywords such as Brand Attachment and the fourth cluster related to the customers’ experience with the brand. In all 37 keywords are present in the chart and the largest node in the chat is that of ‘Brand Love’.
Author co-citations analysis (ACA) gives four cluster. The first cluster, has 11 authors with Rauschnabel P.A., Sarkar A. and Roy S.K. as the major authors. The second cluster has 11 authors with Coelho A., Fetscherin M. and Hussain K. as major authors. The third cluster has 9 authors with Wallace E., Loureiro S.M.C., and Kaufmann H.R., as major authors. The last cluster has 9 authors with Ahuvia A., Bagozzi R.P. and Batra R. as major authors. The articles such as Carroll B.A., Ahuvia A.C. (2006), Batra R., et al (2012), Albert N., Merunka D. (2013), Wallace E., Buil I., de Chernatony L. (2014) and Bergkvist L. (2010) were the most influential works in the Brand love domain as evident Table 5.
| Table 5 Summary Of Brand Love Research And Implication |
||
|---|---|---|
| Current Focus of Brand Love Research | Implication for Future agenda for Brand Love | |
| Dominant Geography | United States, India (Based on Volume) Norway, Finland, South Africa (based on Impact) |
Candidate for collaboration |
| Journals | Journal Of Product And Brand Management, Journal Of Brand Management, Journal Of Retailing And Consumer Services | Systematic Review Papers focussing on these journals. Editors of these journals can offer publication avenues in the form of special issues devoted to brand love. |
| Consistent Authors | Sarkar A., Hussain K., Hou F., Junaid M., Sarkar J.G. | These can act as editors for edited books and special issues. |
| Influential Authors | Ahuvia A., Bagozzi R.P., Batra R. | These should work as chair for Brand Love studies |
| Progression of Keywords | WoM – Brand Engagement – Digital Media – Behavioural element – eWOM in digital media – greening & sustainability | Need to move from BL research in digital environment and embracing new frontiers •Effect of ethical practices on Brand Love •Sustainability (already initiated but need to carry further) • need to be creative here to add furthermore |
| Organizations | School Of Human Environmental Sciences, University Of Arkansas, Fayetteville, Ar, United States Optentia Research Focus Area, North-West University, Vanderbijlpark, South Africa Faculty Of Economics And Centre For Business And Economics Research, University Of Coimbra, Coimbra, Portugal |
These organization can initiate centre for BL studies |
References
Ahlgren, P., & Colliander, C. (2009). Document–document similarity approaches and science mapping: Experimental comparison of five approaches.Journal of informetrics,3(1), 49-63.
Indexed at, Google Scholar, Cross Ref
Bagozzi R.P., Batra R., Ahuvia A. (2017). Brand love: development and validation of a practical scale. Marketing Letters, 28(1), 1-14.
Callon, M., Courtial, J. P., Turner, W. A., & Bauin, S. (1983). From translations to problematic networks: An introduction to co-word analysis.Social science information,22(2), 191-235.
Indexed at, Google Scholar, Cross Ref
Crespo, J. A., Li, Y., & Ruiz–Castillo, J. (2013). The measurement of the effect on citation inequality of differences in citation practices across scientific fields.PLoS One,8(3), e58727.
Indexed at, Google Scholar, Cross Ref
Dubes, R., and Jain, A. K. (1980). Clustering Methodologies in Exploratory Data Analysis. Advances in Computers, 19, 113–228.
Indexed at, Google Scholar, Cross Ref
Fournier, S. (1998). Consumers and their brands: Developing relationship theory in consumer research.Journal of consumer research,24(4), 343-373.
Indexed at, Google Scholar, Cross Ref
Griffith, B. C., Small, H. G., Stonehill, J. A., & Dey, S. (1974). The structure of scientific literatures II: Toward a macro-and microstructure for science.Science studies,4(4), 339-365.
Indexed at, Google Scholar, Cross Ref
Hicks, D., Wouters, P., Waltman, L., De Rijcke, S., & Rafols, I. (2015). Bibliometrics: The Leiden Manifesto for research metrics.Nature,520(7548), 429-431.
Keller, K.L. (2003). Brand synthesis: The multidimensionality of brand knowledge.Journal of consumer research,29(4), 595-600.
Indexed at, Google Scholar, Cross Ref
Murtagh, F. (1984). Structure of hierarchic clusterings: implications for information retrieval and for multivariate data analysis.Information processing & management,20(5-6), 611-617.
Indexed at, Google Scholar, Cross Ref
Patwardhan, H.andBalasubramanian, S.K.(2011), Brand romance: a complementary approach to explain emotional attachment toward brands.Journal of Product & Brand Management, Vol. 20 No. 4, pp. 297-308.
Small, H. (1973). Co?citation in the scientific literature: A new measure of the relationship between two documents.Journal of the American Society for information Science,24(4), 265-269.
Indexed at, Google Scholar, Cross Ref
White, H. D., & Griffith, B. C. (1981). Author cocitation: A literature measure of intellectual structure.Journal of the American Society for information Science,32(3), 163-171.
Indexed at, Google Scholar, Cross Ref
Received: 02-May-2023, Manuscript No. AMSJ-23-13553; Editor assigned: 03-May-2023, PreQC No. AMSJ-23-13553(PQ); Reviewed: 26-Jun-2023, QC No. AMSJ-22-13553; Revised: 02-Aug-2023, Manuscript No. AMSJ-23-13553(R); Published:04-Sep-2023
