Review Article: 2024 Vol: 28 Issue: 1
Assessing the Effectiveness of Online Learning: Insights from Student Experiences
Hansa Subnani, Poornima University, Jaipur
Monika Khatri, Poornima University, Jaipur
Citation Information: Subnani, H., & Khatri, M. (2024). Assessing the effectiveness of online learning: insights from student experiences . Academy of Marketing Studies Journal, 28(1), 1-16.
Abstract
The main purpose of education is to enable the learner to apply, analyse and evaluate the basic concept of education. Now days it is not only limited with books but supported by the online teaching learning process. The use of ICT based technologies has converted the entire teaching pedagogy to learner centred pedagogy. Digital education is fun learning for all students as the innovative audio-video feature boosts the cognitive elements in a student’s brain. Colleges and universities are increasingly adopting digital teaching solutions in their academic, and trying to make the classroom environment more inclusive and participatory. Therefore, the purpose of this paper is to understand the perceptions of the students regarding the effectiveness of online learning modes in teaching learning transactions.
Keywords
Effectiveness, Online teaching learning process, perception, Students.
Introduction
The internet changed the basic rule of the world by placing the most coveted and elite tool in the hand of each person. Information that was earlier available for few people now accessibility to that person who has computer system and network availability. Today’s global community can share their ideas and information without the hindrance of borders. With each passing day people becoming a part of this community and enrich it for future also. There are numerous examples of machines and tools used in online education, but e-learning are the new concept. Television based classes and slide projector have been in use since the 1950’s. Firstly, The University of Toronto offered online education in 1984 than a wholly online institute offered bachelor and master degree by University of Phoenix. This was the beginning of a revolution that would make learning greatly accessible. The Indira Gandhi Open University is the largest Open University in the world with the enrollment of 4 million students. Online learning is booming nowadays and the worldwide market size of online learning is expected to reach approx. USD 374.3 billion in 2026. Experts predict that the next wave of online learning will occur not only in Europe and North America but in India, China and Africa also.
As well as internet has found great utility in education sector. It has bought school/ college in our personal computers and also reduce the hurdles that one face in accessing of higher studies. Higher education had always been available for capitalist but now day’s people living in remote area can also enjoy good guidance from the best faculty.
The traditional brick and mortar classroom is no longer place to clear all concepts and doubts now internet has become booster for students. Of course the importance of traditional classrooms never is undermined but the internet has created a niche for itself in educational sector. The best part of online mode is that it provide common set of slandered to all. Govt. of India is working wonders in their citizens they initiated digital India campaign to transform India into digitally empowered society. GOI promoted the use of information communication technology to improve the teaching learning process.
Worldwide research has shown that information and communication technology or digitalization plays an important role in student learning and positive impact on student achievement. In India student’s efficiency is increasing day by day due to use of digitalization, awareness about digital program, govt. policies & facilities to promote digital education. The main target of government is now on encouraging states for improvement within the quality of education, so digitalization in education can be a boon in quality of education. The entire world is going through the process of digitization and the usefulness of digital technology becomes manifold and enhances the quality of education. This is the time when the whole degree would be awarded without attending the University or College to students but the full promise of online learning is dependent on educational institutes to train teachers for good instructional design, delivery and implementation. Numerous studies have been carried out to understand digitalization of education needs, changing customer perception and challenges, online teaching learning process and awareness of online learning platforms.
The concept of e-learning is definitely increasing in India but at a slow pace in comparison to other countries. For bridging the gap empowering teaching and learning is the need of the hour. Internet has the power to do wonder but if it is misused it can cause disaster.
Literature Review
This review of literature has been done in different -different categories as e- learning platforms, opportunities and challenges of online learning, perception and awareness of students toward online learning and role of Government in development of online learning. Aim of this study to identify the student’s perception towards online education during pandemic situation and what is their views about online examination. study concluded that less % of students satisfied with online education due to network issue, lack of technological knowledge, many students don’t afford laptop and smart mobiles and in the other hand students are happy with the e- assessment and e- examination. This study highlights some key issues as opportunities and Challenges faced by the digital India Program. Author indicates that the success of Digital India Program depends on the belief on the government schemes, commitment of the govt. and the public support. This Digital India Program is a big step towards to become a developed country (Goswami, 2016).
Study divide the Digital education in different categories as Primary and secondary supplement education, Higher Education, Test Preparation, Reskilling and online certifications market and Language and casual Learning. There are many benefits like increase employment skills, mobile learning, global exposure and platform for share the knowledge globally paper conclude that online education is boom for the nation (Seethal et al, 2019)
This paper identify the advantages and adverse impact of digitalization in education, In this paper researcher discussed about basic components of digital education, online learning applications as Google classrooms, E pathshala, Khan Academy and BYJU’s and many others, author concluded that digitalization is need of the hour (Rastogi, 2019). This paper focused on e-learning challenges those are faced by academics in higher education. In this study challenges are classified in five categories as- learning style, cultural challenges, pedagogical e-learning, technological challenges and time management challenges. This research concludes that technical support and training is required by academics (Islam et al, 2015).
This research is based on qualitative approach and information collected by participant’s observation, in depth interviews and open-ended questions. In this paper author found that instructor should have technical skill, good digital literacy and students are also encouraged for better use of digital tools and techniques as well as very few students have an idea about blogs on personal lives and education, but they have interest to create blog. When researcher talked about social media concern in education, he found that teachers and students are commonly connected with the face book and YouTube for education the purpose of this study to find out the awareness & effectiveness level of student towards management and readiness to accept e-learning environment. This is exploratory research and data is collected by students of IIM Ahmadabad, data analysis done by chi-square test, factor analysis and cluster analysis. Study shows that students are comfortable with web-based tools, online exams, assessments, social media, chat and e-books. This study have some limitations because respondent only taken from IIM not from all over India
This paper analyses the impact or effect of online teaching on university students. This study is done in the area of Rajasthan in a small university, data is collected by primary sources by questionnaire, likert scale is used from agree to disagree. Researchers concluded that students are not connected with faculty in online teaching. Teachers and parents should help children to explore their career by online classes and students should take effective participation in the online learning process (Iyer et al, 2021).
Author found the as a benefit students get fast information and easily communicate with each other and there are lot of methods to learn things as well it creates frustration because of anti-technology person, device challenges, network issues and typing difficulties with mobile, author conclude that the limitation with mobile devices students know the impact of it in learning process. author found the as a benefit students get fast information and easily communicate with each other and there are lot of methods to learn things as well it creates frustration because of anti-technology person, device challenges, network issues and typing difficulties with mobile, author conclude that the limitation with mobile devices students know the impact of it in learning process.
This paper aims to identify the motivation to learn by mobile devices at home or schools for primary and secondary school students. This study is done in EU states. They focus on 2 factors perceived usefulness (PU) and perceived ease of use. There are different type of motivation as enjoyment from the uses, social pressure and behaviors. Author wants to identify that these pressure give them enjoyment at school and at home. This is exploratory research and data is collected by primary sources. 148 students of grade 3 were taken as respondents. Study concludes that students feel pressure to play educational games as well as useful for learning and it held their attention (Camilleri et al, 2019).
This paper wants to understand the quality of e-learning and analysis the quality of knowledge. This research is based on qualitative method, in this study author presented 26 dimensions as accuracy, level of detail, appropriate data, objective, innovativeness and so on. This study explore the students perspective towards knowledge quality of e-learning, author found that students want accuracy and correctness of the content in e-learning (Waheed et.al, 2016).
Objective of the Study
To analyze the effectiveness of online learning from student’s perspective.
Research Methodology
This study is based on descriptive and exploratory research design and the data and information has collected by observation method, interview method, Field survey, structured and unstructured questionnaire, pilot survey, telephonic communication and personal visit and secondary data by official websites and government offices. Data collected by Jaipur, Ajmer and Sikar. The sample size is calculating according to the formula n=z2*p*(1-p)/e2 where z=1.96 for a confidence level of 95%, p=proportion, e= margin of error, then n=385 (after round off will keep 400) for this random sampling, stratified sampling, convenience sampling and judgmental sampling method has been used.
Data Interpretation
Effectiveness of online teaching learning process-
The participants were asked to share their opinion towards e-learning. The questions was asked to understand the perception of students regarding online learning.
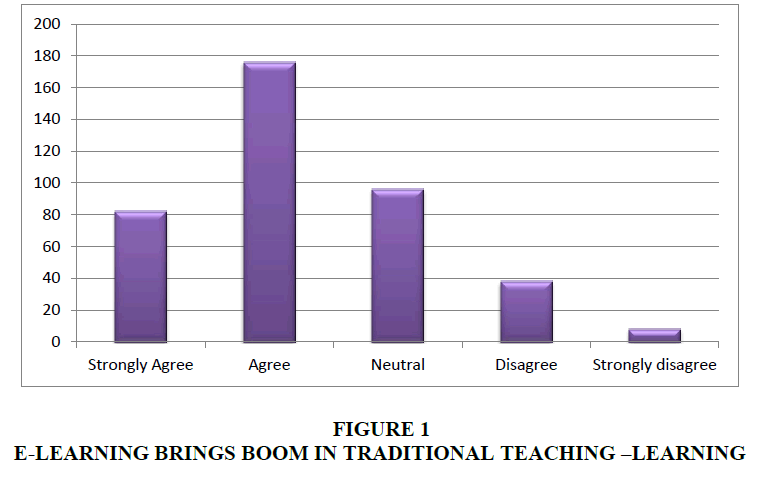
| Table 1 E-Learning Brings Boom In Traditional Teaching –Learning |
|||
|---|---|---|---|
| Levels | Counts | % of Total | Cumulative % |
| Strongly Agree | 82 | 20.5% | 20.5% |
| Agree | 176 | 44.0% | 64.5% |
| Neutral | 96 | 24.0% | 88.5% |
| Disagree | 38 | 9.5% | 98.0% |
| Strongly disagree | 8 | 2.0% | 100.0% |
Source: Researcher Compilation.
In table 1 the researcher noticed these things as they were conducting their research of awareness level of if E learning brings boom in Traditional Teaching -Learning in participants, in which out of all 400 participants, 176 (44.4%) participants were agree that E learning brings boom in Traditional Teaching -Learning, 96 (24.0%) participants were Neutral about the awareness of E-learning, 82 (20.5%) participants were Strongly agree that E learning brings boom in Traditional Teaching -Learning, while 38 (9.5%) participants were disagree about any changes by E-learning, and 8 (2.0%) participants were strongly disagree that E learning doesn’t brings boom in Traditional Teaching -Learning. Thus most of the participants were agreed of fact that E learning brings boom in Traditional Teaching -Learning Figures 1-8.
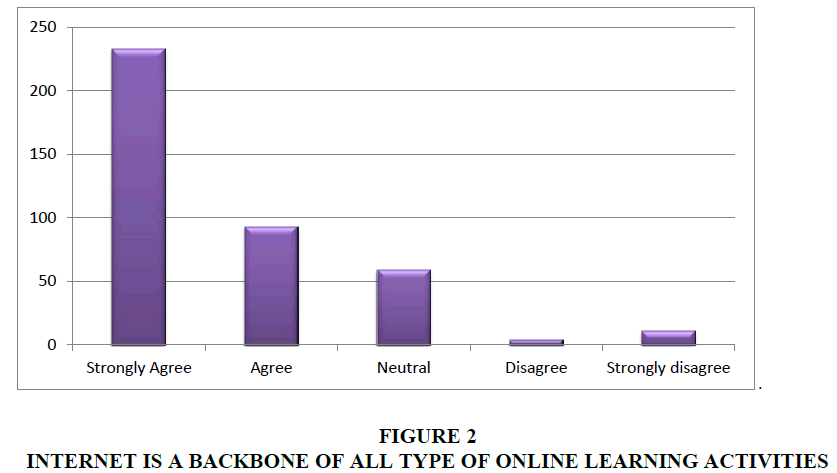
| Table 2 Internet Is A Backbone Of All Type Of Online Learning Activities |
|||
|---|---|---|---|
| Levels | Counts | % of Total | Cumulative % |
| Strongly Agree | 233 | 58.3% | 58.3% |
| Agree | 93 | 23.3% | 81.5% |
| Neutral | 59 | 14.8% | 96.3% |
| Disagree | 4 | 1.0% | 97.3% |
| Strongly disagree | 11 | 2.8% | 100.0% |
Source: Researcher Compilation.
In table 2 it has can be concluded from the research that If Internet is a backbone of all type of online learning activities, in which out of all 400 participants, 93 (23.3%) participants were agreed that Internet is a backbone of all type of online learning activities, 59 (14.8%) participants were Neutral about the same, 233 (58.3%) participants were Strongly agree that Internet is a backbone of all type of online learning activities, while 11 (2.8%) participants were strongly disagree about the fact that Internet is a backbone of all type of online learning activities and only 4 (1.0%) participants were disagree about same. Thus most of the participants were strongly agreed that Internet is a backbone of all type of online learning activities.
| Table 3 Frequencies Of Course On Internet Use (Creating Websites/Home Page, Video Conferencing, Etc.) Is Beneficial |
|||
|---|---|---|---|
| Levels | Counts | % of Total | Cumulative % |
| Strongly Agree | 150 | 37.5% | 37.5% |
| Agree | 178 | 44.5% | 82.0% |
| Neutral | 54 | 13.5% | 95.5% |
| Disagree | 8 | 2.0% | 97.5% |
| Strongly disagree | 10 | 2.5% | 100.0% |
Source: Researcher Compilation.
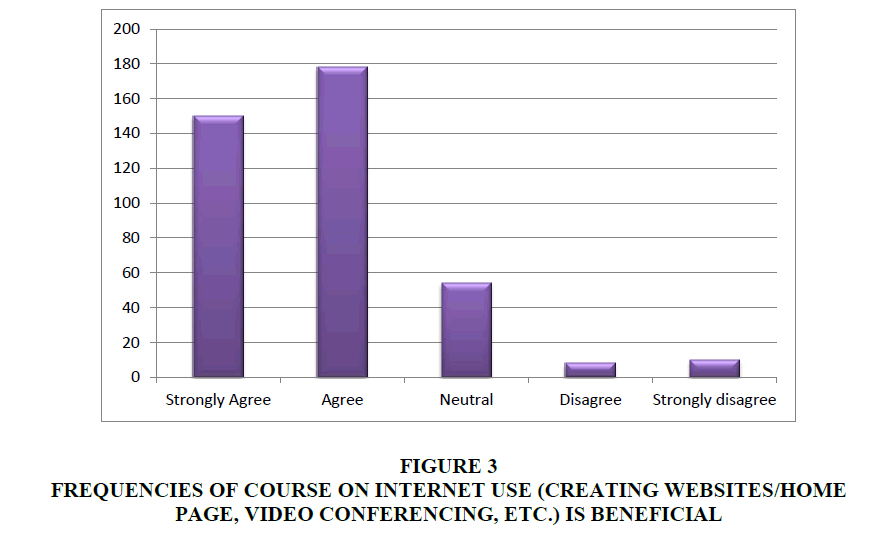
In table 3 Research has shown this to be the case which was about If Course on internet use (creating websites/home page, video conferencing, etc.) is beneficial, in which out of all 400 participants, 178 (44.5%) participants were agreed that Course on internet is beneficial, 54 (13.5%) participants were Neutral about the benefits of internet course, 150 (37.5%) participants were Strongly agree on Course on internet is beneficial, while 10 (2.5%) participants were strongly disagree about the this benefits and only 8 (2.0%) participants were disagree this benefit. Thus most of the participants were agreed that Course on internet use (creating websites/home page, video conferencing, etc.) is beneficial.
Figure 3: Frequencies Of Course On Internet Use (Creating Websites/Home Page, Video Conferencing, Etc.) Is Beneficial.
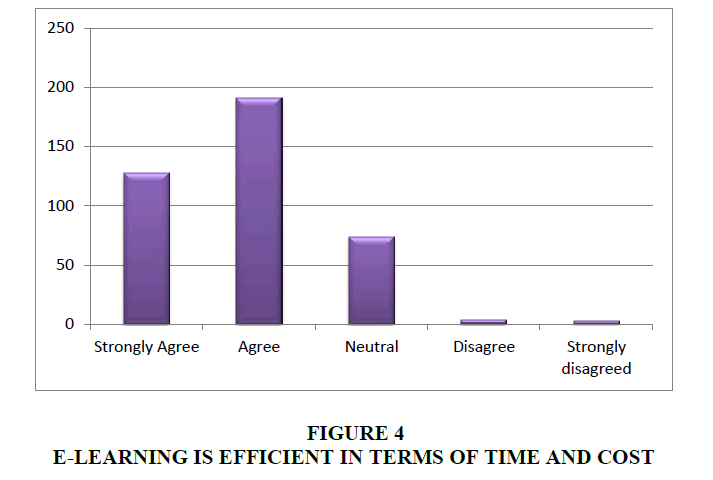
| Table 4 E-Learning Is Efficient In Terms Of Time And Cost |
|||
|---|---|---|---|
| Levels | Counts | % of Total | Cumulative % |
| Strongly Agree | 128 | 32.0% | 32.0% |
| Agree | 191 | 47.8% | 79.8% |
| Neutral | 74 | 18.5% | 98.3% |
| Disagree | 4 | 1.0% | 99.3% |
| Strongly disagreed | 3 | 0.8% | 100.0% |
Source: Researcher Compilation.
In table 4 while doing the study, the researcher noticed if E-learning is efficient in terms of time and cost, in which out of all 400 participants, 191 (47.8%) participants were agreed that E-learning is efficient in terms of time and cost, 74 (18.5%) participants were Neutral about this, 128 (32.0%) participants were Strongly agree about E-learning is efficient in terms of time and cost, while only 3 (0.8%) participants were strongly disagree about this and only 4 (1.0%) participants were disagree on E-learning is efficient in terms of time and cost. Thus most of the participants were agreed that E-learning is efficient in terms of time and cost.
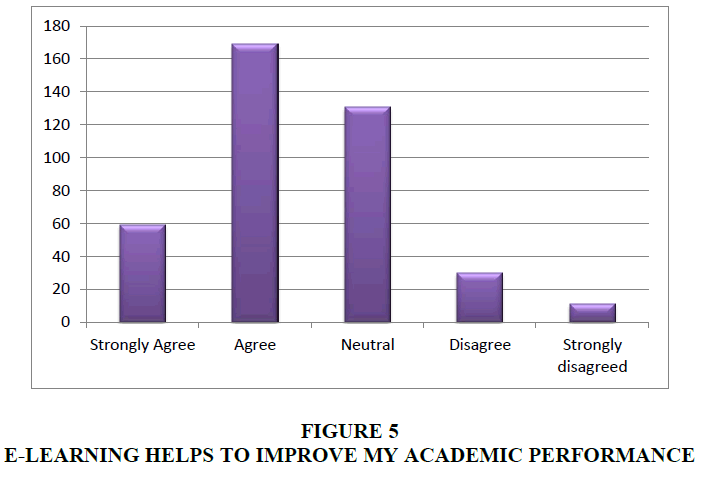
| Table 5 E-Learning Helps To Improve My Academic Performance |
|||
|---|---|---|---|
| Levels | Counts | % of Total | Cumulative % |
| Strongly Agree | 59 | 14.8% | 14.8% |
| Agree | 169 | 42.3% | 57.0% |
| Neutral | 131 | 32.8% | 89.8% |
| Disagree | 30 | 7.5% | 97.3% |
| Strongly disagreed | 11 | 2.8% | 100.0% |
Source: Researcher Compilation.
In table 5 the researcher made observations while conducting the study.if E-learning helps to improve my Academic performance, in which out of all 400 participants, 169 (42.3%) participants were agreed that E-learning helps to improve my Academic performance, 131 (32.8%) participants were Neutral about this, 59 (14.8%) participants were Strongly agree about E-learning helps to improve my Academic performance, while 11 (2.8%) participants were strongly disagree about this and only 30 (7.5%) participants were disagree on E-learning helps to improve my Academic performance. Thus most of the participants were agreed that E-learning helps to improve my Academic performance.
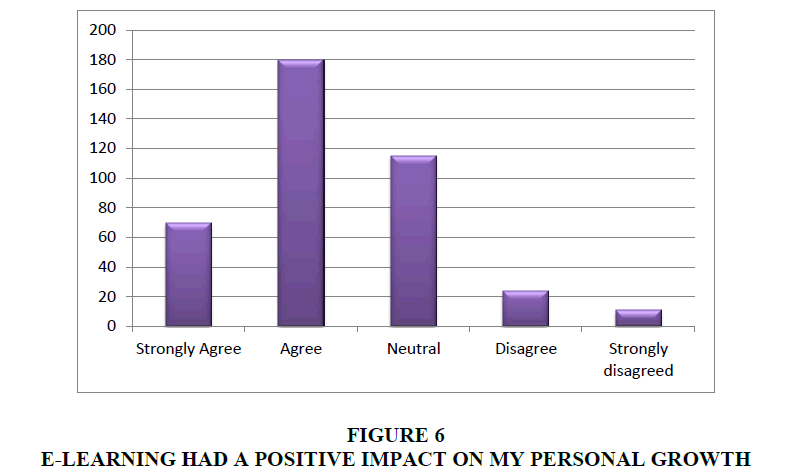
| Table 6 E-Learning Had A Positive Impact On My Personal Growth |
|||
|---|---|---|---|
| Levels | Counts | % of Total | Cumulative % |
| Strongly Agree | 70 | 17.5% | 17.5% |
| Agree | 180 | 45.0% | 62.5% |
| Neutral | 115 | 28.7% | 91.3% |
| Disagree | 24 | 6.0% | 97.3% |
| Strongly disagreed | 11 | 2.8% | 100.0% |
Source: Researcher Compilation.
In table 6 it has been investigated.by the researcher that E-learning having a positive impact on his/her personal growth and noticed that out of 400 respondents 180(45%) of respondents agrees, 115(28.7%) were neutral, 70(17.5%) strongly agrees while 24(6%) of respondents disagrees bout E-learning having a positive impact on personal growth and rest 11(2.8%) Strongly disagreed. Thus maximum number of respondents agrees about E-learning having a positive impact on personal growth.
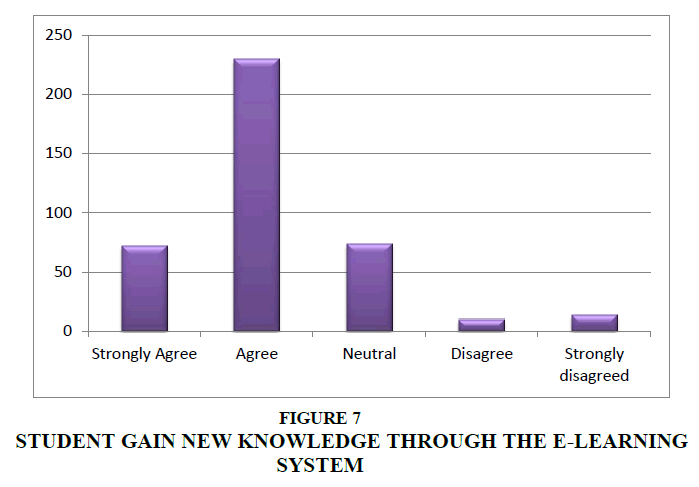
| Table 7 Student Gain New Knowledge Through The E-Learning System |
|||
|---|---|---|---|
| Levels | Counts | % of Total | Cumulative % |
| Strongly Agree | 72 | 18.0% | 18.0% |
| Agree | 230 | 57.5% | 75.5% |
| Neutral | 74 | 18.5% | 94.0% |
| Disagree | 10 | 2.5% | 96.5% |
| Strongly disagreed | 14 | 3.5% | 100.0% |
Source: Researcher Compilation.
In table 7 throughout the research, this has been noticed about gaining new knowledge through the e-learning system and noticed that out of 400 respondents , 230 (57.5 %) of respondents agrees, 74 (18.5 %) were neutral, 72 (18.0 %) strongly agrees while 14 (3.5 %) of respondents strongly disagreed about gaining new knowledge through the e-learning system 10 (2.5%) disagreed. Thus maximum number of respondents agrees about gaining new knowledge through the e-learning system.
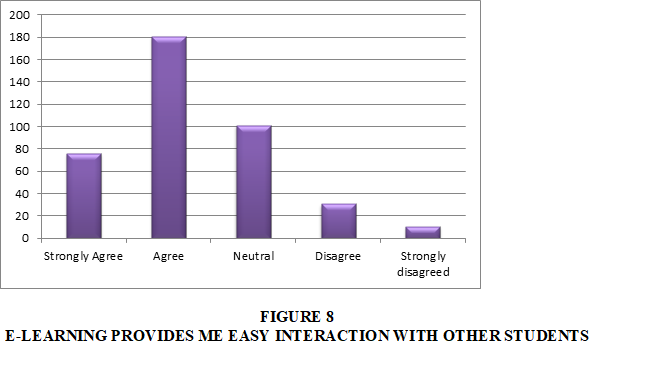
| Table 8 E-Learning Provides Me Easy Interaction With Other Students |
|||
|---|---|---|---|
| Levels | Counts | % of Total | Cumulative % |
| Strongly Agree | 76 | 19.0% | 19.0% |
| Agree | 181 | 45.3% | 64.3% |
| Neutral | 101 | 25.3% | 89.5% |
| Disagree | 31 | 7.8% | 97.3% |
| Strongly disagreed | 11 | 2.8% | 100.0% |
Source: Researcher Compilation.
In table 8 the researcher noticed these things as they were conducting their research about E-learning providing easy interaction with other learners and noticed that out of 400 respondents ,181 (45.3 %) of respondents agrees, 101 (25.3 %) were neutral, 76 (19.0 %) strongly agrees while 31 (7.8 %) of respondents disagreed about gaining new knowledge through the e-learning system and rest 11 (2.8 %) strongly disagreed. Thus maximum number of respondents agrees about E-learning providing easy interaction with other learners.
Hypothesis Testing
H1: Effectiveness of the e-learning system has no impact on student’s perception and satisfaction.
H2: Effectiveness of the e-learning system has positive impact on student’s perception and satisfaction.
Path Analysis
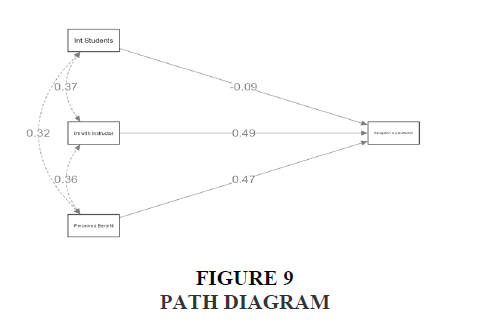
The table providing the estimation of a regression model with the dependent variable "Perception & Satisfaction" and three independent variables: "Perceived Benefit", "Int with Instructor", and "Int Students".
The estimation method used is maximum likelihood (ML), which is a common method for estimating parameters in regression models. The number of observations used in the estimation is 400, and there are five free parameters, which likely include the intercept term and the three coefficients for the independent variables, as well as potentially some variance or covariance parameters if the model includes more than one dependent variable.
The model appears to have converged, meaning that the estimation algorithm successfully found a set of parameter estimates that maximize the likelihood function. The log likelihood of the user-specified model is -231.091, and the log likelihood of the unrestricted model (which likely includes only an intercept term) is also -231.091. This suggests that the user-specified model does not provide a significantly better fit to the data than the intercept-only model.
Finally, the model formula specifies that "Perception & Satisfaction" is modelled as a function of the three independent variables: "Perceived Benefit", "Int with Instructor", and "Int Students". The specific functional form of the model (e.g., linear, quadratic, etc.) is not clear from the information provided.
In above table baseline model was tested, but the results are not fully specified. The label of the model is "Baseline Model", which suggests that this is a simple model with no independent variables, possibly only an intercept term. The test statistic for the model is reported as X2, which could be a chi-squared test statistic or some other goodness-of-fit statistic.
The degrees of freedom (df) for the model are reported as 3, which could refer to the number of independent variables in the model, or it could refer to the number of parameters estimated in the model, including the intercept and any variance or covariance parameters.
The p-value for the model is reported as "< .001", which suggests that the model provides a significantly better fit to the data than a null model with no independent variables. However, without more information about the specific test used and the degrees of freedom, it is difficult to interpret these results fully.
The above table provides the several fit indices for a model, including the Akaike Information Criterion (AIC), the Bayesian Information Criterion (BIC), the adjusted BIC, the standardized root means square residual (SRMR), and the root mean square error of approximation (RMSEA).
The AIC and BIC are measures of model fit that take into account the complexity of the model and penalize models with more parameters. Lower values of AIC and BIC indicate better model fit. The adjusted BIC is a variant of the BIC that includes an additional penalty for small sample sizes.
The SRMR is a measure of the average difference between the observed correlations among variables and the correlations implied by the model. Lower values of SRMR indicate better model fit.
The RMSEA is a measure of how well the model fits the data, taking into account both the discrepancy between the observed and predicted covariance matrices and the complexity of the model. Lower values of RMSEA indicate better model fit.
The RMSEA is reported along with a 95% confidence interval (CI) and a p-value. The confidence interval provides an estimate of the precision of the RMSEA estimate, and the p-value indicates whether the RMSEA is significantly different from zero.
Based on the information provided, the model appears to fit the data well, as all fit indices are at or near perfect values. However, it is difficult to provide a more detailed interpretation without more information about the model and the data.
The information provided includes several fit indices for a model, including the Comparative Fit Index (CFI), Tucker-Lewis Index (TLI), Root Mean Square Error of Approximation (RMSEA), Goodness of Fit Index (GFI), Adjusted Goodness of Fit Index (AGFI), and Parsimony Goodness of Fit Index (PGFI).
The CFI and TLI are measures of how well the model fits the data relative to a null model. Both indices range from 0 to 1, with values closer to 1 indicating better model fit. A value of 1.0 indicates perfect fit.
The RMSEA is a measure of how well the model fits the data, taking into account both the discrepancy between the observed and predicted covariance matrices and the complexity of the model. Lower values of RMSEA indicate better model fit. A value of 0.0 indicates perfect fit.
The GFI, AGFI, and PGFI are measures of how well the model fits the data relative to a saturated model. The GFI and AGFI range from 0 to 1, with values closer to 1 indicating better model fit. The PGFI is a measure of parsimony, or how well the model fits the data relative to a simpler model. A value of 1.0 indicates perfect fit.
Based on the information you provided, all fit indices have perfect values, indicating that the model fits the data well. However, it is important to consider other aspects of the model and data when interpreting the results.
Estimates
The table includes the coefficient of determination, or R-squared, for a model, along with 95% confidence intervals.
R-squared is a measure of how well the model explains the variance in the outcome variable. It ranges from 0 to 1, with higher values indicating that more of the variance in the outcome variable is explained by the model.
The confidence intervals indicate the range of values within which the true population R-squared value is expected to fall with 95% probability.
Based on the information you provided, the model has an R-squared of 0.665, with lower and upper confidence intervals of 0.609 and 0.716, respectively. This indicates that the model explains a substantial proportion of the variance in the outcome variable, and the results are likely to be reliable.
The table provides the parameter estimates for a multiple regression model, along with 95% confidence intervals.
The parameter estimates represent the estimated effect of each predictor variable on the outcome variable, while holding all other variables constant. The standard error (SE) indicates the precision of the estimate. The confidence intervals provide a range of values within which the true population parameter is expected to fall with 95% probability.
Based on the information you provided, the model includes three predictor variables: Perceived Benefit, Int with Instructor, and Int Students. The parameter estimates and confidence intervals are as follows:
Perceived Benefit: The estimate is 0.4726, with a standard error of 0.0386, and lower and upper confidence intervals of 0.397 and 0.5483, respectively. This suggests that a one-unit increase in Perceived Benefit is associated with an increase of 0.4726 units in Perception & Satisfaction, on average, while holding all other variables constant.
Int with Instructor: The estimate is 0.4867, with a standard error of 0.0418, and lower and upper confidence intervals of 0.405 and 0.5686, respectively. This suggests that a one-unit increase in Int with Instructor is associated with an increase of 0.4867 units in Perception & Satisfaction, on average, while holding all other variables constant.
Int Students: The estimate is -0.0915, with a standard error of 0.0408, and lower and upper confidence intervals of -0.172 and -0.0114, respectively. This suggests that a one-unit increase in Int Students is associated with a decrease of 0.0915 units in Perception & Satisfaction, on average, while holding all other variables constant.
The p-values for all three estimates indicate that they are statistically significant, with p-values less than 0.05. This means that we can reject the null hypothesis that the true population parameter is zero, and conclude that each predictor variable has a significant effect on the outcome variable.
Based on the provided table, it seems like the variables are being compared in pairs, and for each pair, an estimate, standard error (SE), lower and upper bounds of a 95% confidence interval (CI), a beta (β), a z-score, a p-value, and the method and type of analysis are given.
For the variable pairs of Perception & Satisfaction, Perceived Benefit, Int with Instructor, and Int Students, only the estimates, standard errors, and confidence intervals are provided, which suggest that they are being compared to themselves, i.e., they are being analyzed for their own variances. For the remaining pairs of variables, the beta (β), z-score, and p-value are given, which indicate that they are being analyzed for their covariance or correlation.
The beta (β) represents the estimated regression coefficient, which indicates the amount of change in the dependent variable for a unit change in the independent variable. The z-score measures the number of standard deviations that the observed value is away from the expected value under the null hypothesis. The p-value represents the probability of observing a value as extreme as or more extreme than the observed value under the null hypothesis, and a value less than 0.05 is typically considered statistically significant. The method and type of analysis are also provided for each pair of variables. In some cases, it appears that a residual-based method was used to estimate the covariance or correlation, while in other cases; a sample-based method was used. The provided table shows the intercepts, standard errors (SE), and 95% confidence intervals (CI) for four variables: Perception & Satisfaction, Perceived Benefit, Int with Instructor, and Int Students.
The intercept represents the predicted value of the dependent variable when all independent variables are equal to zero. In the case of Perceived Benefit, Int with Instructor, and Int Students, the intercepts are simply the estimated means of the respective variables since there are no independent variables being compared.
For Perception & Satisfaction, the intercept is 0.368, which means that when both Perception and Satisfaction are equal to zero, the predicted value of the dependent variable is 0.368. The SE of the intercept is 0.081, which indicates the variability of the estimate. The 95% confidence interval of the intercept is [0.210, 0.526], which means that we can be 95% confident that the true intercept falls within this range. The z-score and p-value are also provided for each intercept. The z-score measures how many standard errors the observed value is away from the expected value under the null hypothesis. The p-value represents the probability of observing a value as extreme or more extreme than the observed value under the null hypothesis, and a value less than 0.05 is typically considered statistically significant. For all four intercepts, the p-value is less than 0.05, indicating that they are statistically significant.
Path Model
Managerial Implication
This study gives information for the future researchers who replicate the study for variety of courses. This study can provide the insight view of effectiveness from student perspective. It is helping to focus more on the learning environment for the students.
This research reveals the deep view of online education for the institution and Government for the betterment of online education.
Conclusion
Considering these aspects of online teaching learning process- effectiveness, benefits and challenges, we explored that universities and colleges have put their best efforts to continue using various tools of ICT in online teaching learning process. The students had huge opportunities to learn from experts in virtual mode irrespective of distance in a structured, organized, and effective manner. Above results indicate that online learning increase the access, knowledge, academic performance of students. Therefore students suffer from poor internet connectivity, it does not suit to all teaching learning styles and require appropriate training for proper access. Since most of the students are satisfied with the virtual teaching mode, the blended teaching-learning methods can be introduced in post-pandemic. Digitalization increases access to new culture, the spread of technology, literacy rate become high and most favorable impact on environment, owing to the need for less paper, reduce administrative burden for the teachers and make possibility of communication.
References
Camilleri, M.A., & Camilleri, A. C. (2020). The Students’ Readiness To Engage With Mobile Learning Apps. Interactive Technology And Smart Education, 17(1), 28–38.
Indexed at, Google Scholar, Cross Ref
Chawla, D., & Joshi, H. (2019). Consumer Attitude And Intention To Adopt Mobile Wallet In India – An Empirical Study. International Journal Of Bank Marketing.Emerald Publishing Limited, 37(7), 1590–1618.
Indexed at, Google Scholar, Cross Ref
Gikas, J., & Grant, M. M. (2013). Mobile Computing Devices In Higher Education: Student Perspectives On Learning With Cellphones, Smartphones & Social Media. Internet And Higher Education, 19, 18–26.
Indexed at, Google Scholar, Cross Ref
Goswami, H. (2016). Opportunities and challenges of digital India programme. International Education and Research Journal, 2(11), 78-79.
Islam, N., Beer, M., & Slack, F. (2015). E-Learning Challenges Faced By Academics In Higher Education: A Literature Review. Journal Of Education And Training Studies, 3(5).
Iyer, S., Prof, A., & Soni, K. (2010). IMPACT OF ONLINE LEARNING ON UNIVERSITY STUDENTS,
Kumar, R. (2020). Students’ Perception Towards Digitization Of Education After Covid-19: A Survey. In International Journal Of Engineering, Science, Technology And Innovation (IJESTI) IJESTI (Vol. 1, Issue 1). Www.Ijesti.Com.
Rastogi, H. (2019). Digitalization of education in India–An analysis. International Journal of Research and Analytical Reviews, 6(1), 1273-1282.
Seethal, K., Menaka, B., & Scholar, R. (2019). Digitalisation Of Education In 21 ST Century: A Boon Or Bane.
U?ur, N. G., & Guliz Ugur, N. (2020). Digitalization In Higher Education: A Qualitative Approach. The International Journal Of Technology In Education And Science (IJTES) International Journal Of Technology In Education And Science, 4(1), 18–25.
Waheed, M., Kaur, K., & Qazi, A. (2016). Students’ Perspective On Knowledge Quality In Elearning Context: A Qualitative Assessment. Internet Research, 26(1), 120–145.
Indexed at, Google Scholar, Cross Ref
Received: 17-Jun-2023, Manuscript No. AMSJ-23-13703; Editor assigned: 19-Jun-2023, PreQC No. AMSJ-23-13703(PQ); Reviewed: 29-Sep-2023, QC No. AMSJ-23-13703; Revised: 16-Oct-2023, Manuscript No. AMSJ-23-13703(R); Published: 13-Nov-2023
