Research Article: 2021 Vol: 24 Issue: 6
Antecedents of work performance: The effect of leadership style and work motivation
Mahir Pradana, Telkom University
Tri Indra Wijaksana, Telkom University
Yahya Arwiyah, Telkom University
Nurul Fadhillah, Telkom University
Citation Information: Pradana, M., Wijaksana, T. R., Arwiyah, Y., & Fadhillah, N. (2021). Antecedents of work performance: The effect of leadership style and work motivation. Journal of Management Information and Decision Sciences, 24(6), 1-8.
Abstract
Management studies have acknowledged the influence of leadership style and motivation on employee performance. To contribute to this broad focus of study, we conducted our research at Terminal Petikemas Koja, Jakarta, Indonesia. Data collection was carried out by distributing questionnaires and carried out on employees of Koja Container Terminal. We developed quantitative causal study and conducted data analysis with SPSS software. The results of the analysis show that leadership style has a significant positive effect on employee performance, as well as motivation, which also has a significant positive effect on employee performance.
Keywords
Management; Personnel management; Business analysis; Business administration.
Introduction
An organization is a consciously coordinated social unit with identifiable reactive boundaries, working continuously to achieve goals (Robbins & Davidhizar, 2020). All actions taken in each activity are initiated and determined by human beings who are members of the company. Companies need potential human resource factors, both leaders and employees, in the task and supervision patterns that determine the achievement of company goals (Saragih et al., 2018). Our study examined the number of complaints received by Koja Container Terminal increased steadily from 2018 to 2020. This fact may indicate that the performance of Koja Container Terminal employees has continued to decline, which has increased the number of complaints over the last three years. The interviews with several employees found that there was an indication of a weak leadership style at Koja Container Terminal.
Next, what needs to be considered in this Koja Container Terminal is an indication of a decrease in employee motivation, which impacts employee performance at Koja Container Terminal (Hidayat & Hidayat, 2017). Based on the description above and seeing the importance of a leadership style and its relationship with employee expectations, work motivation, work discipline in determining the success of performance at Koja Container Terminal. Based on the background that has been described previously. The formulation of the problem is as follows: How are the simultaneous influences of leadership style, work motivation, and work discipline on employee performance at Terminal Petikemas Koja? Last is how leadership style, work motivation and work discipline partially on employee performance in Terminal Petikemas Koja.
Literature Review
Leadership Style, Discipline and Motivation
It is an opportunity to fulfill a leadership role and be seen as an example. It is also the time when leadership qualities and styles will surface. Leadership style refers to the characteristic behavior of a leader when managing a group of people (Pradana et al., 2020). According to Malthis and Jackson (2001), motivation is a desire within a person that causes that person to take action. To discuss motivation more deeply, here Liputan6.com has summarized it from various sources. Motivation is the process of giving encouragement, direction, and persistence in behavior (Pradana, 2015). That is, motivated behavior is behavior that is full of energy, directed and lasts a long time. Motivation is a phenomenon involved in stimulating action towards certain goals that previously had little or no movement towards certain goals. Moreover, motivation is an attempt to enlarge or make a movement to achieve certain goals (Fakhri et al., 2021).
Employee Performance
By using a survey, job satisfaction is assessed from several aspects such as management, understanding of the vision and mission, cooperation, communication, motivation, and interactions with other employees (Hoa et al., 2020). These various aspects are of course not absolute and can be different for each company. The second way that can be tried is by holding a group discussion. In this discussion, Human Resources (HR) department can ask questions to find out answers related to employee satisfaction (Fakhri et al., 2020).
Rubin (2009), author of The Happiness Project, mentions 7 things that can increase employee happiness and job satisfaction in the office. According to Rubin, employees will feel happier if they can have more control over their schedules. Some things that companies can do, for example, impose more flexible working hours to free employees to decorate their work desks (Gilang et al., 2019). Companies can help employees reduce stress on the road by changing working hours, such as later hours of entry, removing tardiness rules that are too strict, or allowing employees to work from home at certain times (Hidayat & Hidayat, 2017).
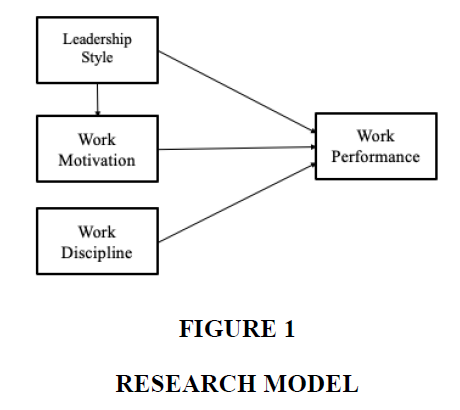
The research model can be visualized as this model (Figure 1):
The relationships between leadership style variables and performance are:
H1: Leadership style has a positive effect on employee performance
H2: Work motivation has a significant positive effect on employee performance
H3: Work discipline has a significant positive effect on employee performance.
Research Methodos
Data Collection
This research was conducted on the leadership style of the North Jakarta Koja TPK. Research respondents were employees of TPK Koja North Jakarta who had worked at Koja Jakarta Petikemas Terminal for several years. Collecting data in this study using a questionnaire distributed via google form to 112 respondents. Questionnaire considered valid if the statement on the questionnaire by the respondent is answered completely and in each statement there is only one answer. If all data and information have been collected, the data will be processed using the SPSS 24 (Statistical Package for the Social Sciences) program.
Results and Discussion
Classic Assumption Test: Normality Test
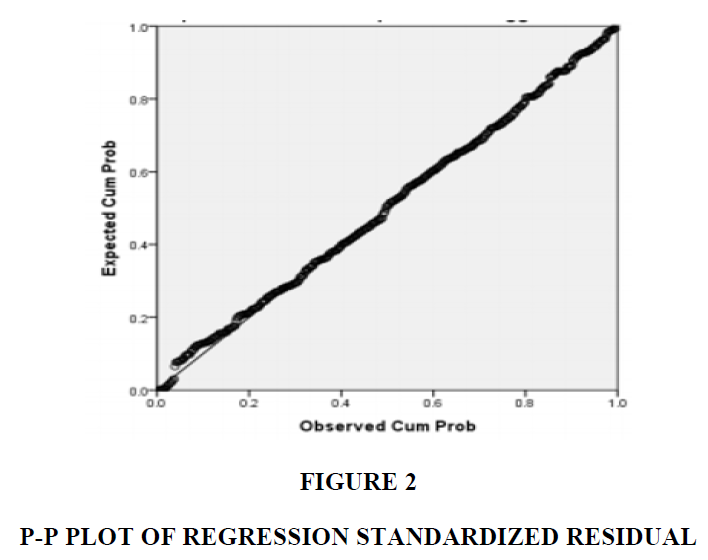
According to Sugiyono (2017), the normality test is a test used to determine the distribution of data in the variables used in the study by having decent and good data, namely data that is normally distributed. According to Kartawinata et al. (2017), the data normality test is carried out so that the data in the population is normally distributed which is then used in the statistical test (t test or F test) to be interpreted into population parameters. Data normality test can be done in two ways, namely through graphical tests and statistical tests. Graph test can be done by looking at the histogram graph and the probability norm plot.
Figure 2 shows that the data spreads around the diagonal line and follows the direction of the diagonal line. Therefore, based on the image and decision-making criteria, the first one is met, that is, data is normally distributed.
Multicollinearity Test
Test criteria
1. Variance Inflation Factor (VIF) 10 then the variable has a multicol problem.
2. Tolerance >0.1 then the variable does not have a multicollin problem and if Tolerance <0.1 then the variable has a multicollinearity problem.
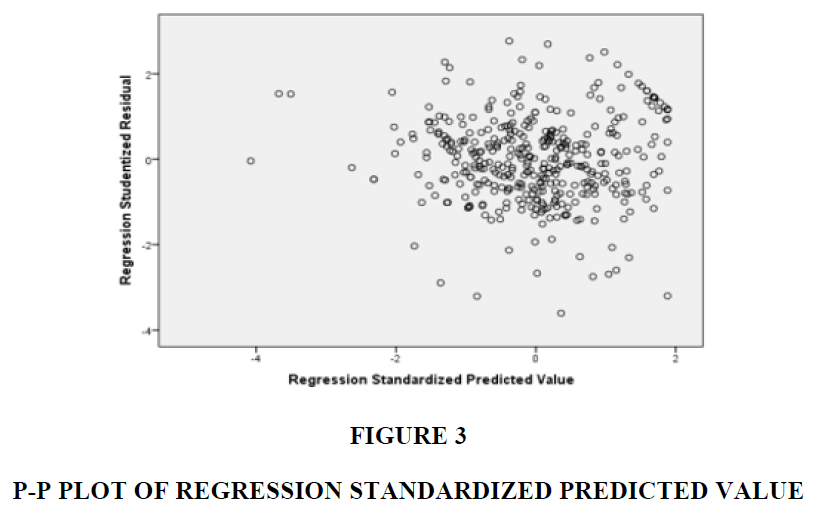
Multicollinearity test results can be seen in Figure 3 as follows.
Multiple Regression Analysis was used to determine the effect of Independent Variables (Leadership Style, Motivation, Work Discipline) on Bound Variables (Employee Performance) which was carried out on 112 respondents at Terminal Petikemas Koja, North Jakarta. To be able to determine the relationship between the two variables in this study, the following calculations were used.
Y = 0,211 + 0,316 X1 + 0,343 X2 + 0,222 X3
Information:
Y = Employee Performance
X1 = Leadership Style
X2 = Motivation
X3 = Work Discipline
Based on this equation, it can be described as follows:
a. Constant (a) = 0.211. That is, if the value of leadership style, motivation, and discipline is 0, then customer satisfaction is 0.211.
b. The regression coefficient value of the Leadership Style variable (��1) is positive, namely 0.316. This means that every increase in Leadership Style by one unit, then customer satisfaction will increase by 0.316.
Hypothesis Testing
Hypothesis testing in this study is conducted to test the hypotheses that have been formulated. Hypothesis testing is divided into two, namely simultaneous hypothesis testing (F test) and partial hypothesis testing (t test). The F test in this study used ANOVA. This test is used to determine the joint effect (simultaneously) of variables X1 (Leadership Style) and X2 (Motivation), X3 (Work Discipline) on variable Y (Employee Performance) by comparing Fhitung with Ftable.
Statistical Hypothesis

Meaning: Leadership Style, Motivation, and Work Discipline simultaneously do not have a significant effect on the Employee Performance of TPK Koja, North Jakarta.

Meaning: Leadership Style, Motivation, and Work Discipline simultaneously do not have a significant effect on the Employee Performance of TPK Koja, North Jakarta.
The criteria for evaluating the hypothesis test simultaneously are:
a. Fcount> Ftable and the significance value is less than 0.05, then H0 is rejected and Ha is accepted. This shows that there is a significant effect of the independent variables on the dependent variable.
b. Fcount <Ftable and a significance value of more than 0.05, then H0 is accepted and Ha is rejected. This shows that there is no significant effect of the independent variables on the dependent variable.
The results of the F test using SPSS 20 can be seen in Table 1.
| Table 1 F-Test Anovab | |||||
| Model | Sum of Squares | DF | Mean Square | F | Sig. |
| Regression | 561.611 | 3 | 187.204 | 50.113 | 0.000a |
| Residual | 403.452 | 108 | 3.736 | ||
| Total | 965.063 | 111 | |||
b.Dependent Variable: Kinerja Karyawan
The Effect of Leadership Style on Employee Performance
The results of hypothesis testing (H1) shows the influence between leadership style on employee performance. Through the results of calculations that have been done, the t value of 3.784 with a significance level of 0.000 is smaller than 0.05, thus Ha is accepted and Ho is rejected. This test statistically proves that the leadership style has a positive effect on employee performance. The results of hypothesis testing (H2) have proven that there is an influence between motivation on employee performance. The results of hypothesis testing (H3) also shows that there is an influence between work discipline on employee performance. This means that there is an influence between work discipline variables on employee performance at TPK Koja. These results support previous research by (Budi Setiyawan and Waridin, 2006).
The R value is 0.763 and the R square (R2) is 0.582. This figure is used to see the amount of influence (leadership style, motivation, and work discipline) on employee performance simultaneously. The way to calculate R square uses the coefficient of determination (KD) using the following formula:

This figure shows the coefficient of determination (KD) of 58.3%. This shows that the effect of the independent variables (leadership style, motivation, and work discipline) on the dependent variable of employee performance is 58.3% while the remaining 41.7% is influenced by other factors in this study.
Conclusion
Based on the results of research and discussion that has been stated previously regarding the influence of leadership style, motivation, and work discipline on the performance of employees at Terminal Petikemas Koja, North Jakarta, several conclusions can be drawn which are expected to provide answers to the problems formulated in this study are as follows:
Leadership Style on the Performance of TPK Koja Employees
Based on the results of descriptive analysis, leadership style has a positive influence on employee performance. Judging from the calculations that have been done, the coefficient value of 0.316 and the t value of 3.784 with a significance value of 0.000 is less than 0.05, thus Ha is accepted and Ho is rejected. This supports the research conducted by research according to Hasbi et al. (2021) that the leadership style basically emphasizes respecting individual goals so that later individuals will have confidence that actual performance will exceed their performance expectations.
Motivation on the Performance of TPK Koja Employees
Based on the results of descriptive analysis, there is an influence between motivation and employee performance. Judging from the calculations that have been done, the coefficient value is 0.343 and the t value is 3.628 with a significance level of 0.000 which is less than 0.05, which means that the hypothesis in this study accepts Ha and rejects Ho. This supports the research conducted by Augustrianto et al. (2017) suggesting that one of the factors affecting performance is worker motivation.
Work Discipline on the Performance of TPK Koja Employees
Based on the results of descriptive analysis, work discipline has a positive effect on employee performance. The coefficient value is 0.222 and the t value is 2.665 with a significance level of 0.009 which is less than 0.05, which means that the hypothesis in this study rejects Ho and accepts Ha.
Employee Performance at TPK Koja
Based on the results of descriptive analysis, overall customer satisfaction in the eyes of the respondents is quite good. Of the overall customer satisfaction statement items that get the lowest respondent's response and fall into the fairly good category. Based on the results of simultaneous hypothesis testing (F-Test F), the variables of leadership style, motivation, and work discipline simultaneously have a significant effect on employee performance in Koja Container Terminal. The magnitude of the influence of leadership style, motivation, and work discipline simultaneously has a significant effect on employee performance, which is 58.3%, while the remaining 41.7% is influenced by other factors such as perceived risk or trust factors which were not examined in this study.
Last, based on the results of the partial hypothesis test (T-test) the variables of leadership style, motivation, and work discipline simultaneously have a significant effect on the performance of employees of Koja Container Terminal. The variable that has the greatest significant influence is leadership style, followed by motivation and the smallest variable is work discipline.
Recommendations
Based on the results of the conclusions described above, the researcher can provide several suggestions that would be useful for the Koja Container Terminal company, North Jakarta:
a. Koja Container Terminal should review the queuing system in payment services at the billing and front office.
b. Koja Container Terminal should increase employee utility by speeding up shift change times.
For further researchers it is suggested:
a. Conducting research on variables not examined in this study based on the results of the study have a considerable influence on employee performance.
b. Conducting research on the variables of leadership style, motivation, and work discipline, using theories from different and up-to-date experts so as to add to the wealth of knowledge in the field of human resources.
References
- Augustrianto, A., Silvianita, A., & Ferari, E. (2019) Hofstede’s organization culture on deviant workplace behavior (Case study on workers at plaza Toyota Bandung). Journal of Advanced Research in Dynamical and Control Systems, 11(3), 720-725.
- Fakhri, M., Nurnida, I., Winarno, A., Kurnia, B., & Suryana, D. (2020). Characteristics of Quality of Work Life on Employees at Consultant Company in Indonesia. The Journal of Asian Finance, Economics, and Business, 7(11), 1105-1111.
- Fakhri, M., Syarifuddin, S., Winarno, A., Nurnida, I., & Hanum, S. Democratic Leadership Practice to Construct Clan Organizational Culture in Family Companies. (2021). The Journal of Asian Finance, Economics, and Business, 8(1), 803-811.
- Fakhri, M., Pradana, M., Syarifuddin, S., & Suhendra, Y. (2020). Leadership Style and its Impact on Employee Performance at Indonesian National Electricity Company. The Open Psychology Journal, 13(1), 321-325.
- Gilang, A., Fakhri, M., Syarifuddin, S., Pradana, M., & Utami, D.P. (2019). Ethical leaderships and organizational culture of student organization at Indonesian Private University. Proceedings of the International Conference on Industrial Engineering and Operations Management, 2019, pp. 70-78.
- Hasbi, I., Pradana, M., & Saragih, A.L.P. (2021). Literacy Of Organizational Culture’S Effects On Work Performance. Academy of Strategic Management Journal, 20(1), 1-6.
- Hidayat, R., & Hidayat, A. M. (2017). Contribution of Environment Online Store for Purchase Decision (A Case Study Online Store Hypermart-Bandung). Advanced Science Letters, 23(1), 292-294.
- Hoa, N. D., Ngan, P. T., Quang, N. M., Thanh, V. B., & Quyen, H. V. (2020). An Empirical Study of Perceived Organizational Support and Affective Commitment in the Logistics Industry. Journal of Asian Finance, Economics and Business, 7(8), 589-598.
- Kartawinata, B. R., Maharani, D., Pradana, M., & Amani, H. M. (2020). The Role of Customer Attitude in Mediating the Effect of Green Marketing Mix on Green Product Purchase Intention in Love Beauty and Planet Products in Indonesia. Proceedings of the International Conference on Industrial Engineering and Operations Management, 2020.
- Malthis, R. L., & dan Jackson, J. H. (2001). Manajemen Sumber Daya Manusia. Salemba Empat. Jakarta.
- Mangkunegara, A. A. P. (2016). Manajemen sumber daya manusia perusahaan. PT. Remaja Rosdakarya.
- Nguyen, L. G., & Pham, H. T. (2020). Factors Affecting Employee Engagement at Not-For-Profit Organizations: A Case in Vietnam. Journal of Asian Finance, Economics and Business, 7(8), 495-507.
- Pradana, M. (2015). Pengaruh Gaya Kepemimpinan Terhadap Motivasi Karyawan di Ganesha Operation, Bandung. Jurnal Studi Manajemen dan Bisnis, 2(1), 24-39.
- Pradana, M., Pérez-Luño, A., & Fuentes-Blasco, M. (2020). Innovation as the key to gain performance from absorptive capacity and human capital. Technology Analysis & Strategic Management, 32(7), 822-834.
- Robbins, B., & Davidhizar, R. (2020). Transformational leadership in health care today. The Health Care Manager, 39(3), 117-121.
- Rubin, G. (2009). The happiness project. New York: HarperCollins.
- Saragih, R., Fakhri, M., Pradana, M., Gilang, A., & Vidjashesa, G. A. (2018). Ethical Leadership’s Effect on Employee Discipline: Case of An Indonesian Telecommunication Company. In Proceedings of the International Conference on Industrial Engineering and Operations Management. pp. 1630-1638.
- Sugiyono, S. (2017). Quantitative and Qualitative Methodologies in R&D. 25th edition. Bandung: Alfabeta.
- Sulistijono, S., Pradana, M., Hasbi, I., Nugraha, D. W., Siregar, M. A. H., & Habibi, R. (2020). Web-based application of high school laboratory administration: Case study at sma pasundan 8, Bandung, Indonesia. Proceedings of the International Conference on Industrial Engineering and Operations Management, 2020. Detroit, USA: IEOM Society International.
- Winarno, A., & Hermana, D. (2019). Commitment, work engagement, and research performance of lecturers, in Indonesia private universities. Malaysian Online Journal of Educational Management, 7(4), 45-63.


