Research Article: 2018 Vol: 17 Issue: 5
An Exploration into the Determinants of Retail Investors Investment Behaviour about Initial Public Offers in Indian Scenario
S.Saravanan, Sathyabama Institute of Science and Technology
R. Satish, Jeppiaar Engineering College
Abstract
Purpose of this paper is to identify constructs involved in Retail Investors Investment Behaviour towards Initial Public Offers and suggest a model to understand the relationship between various construct considered. Data was collected through structured questionnaire from selected sample size and finally 504 responses were used to justify the structure. The study determined four variables Information Asymmetry, Representativeness and Familiarity (Heuristics), Market/Company Perception and Societal Perception. Also the study contributed in identifying a model that can show a meaningful relationships among the variables identified and Intention of an investor towards IPO investments. Though the four considered had a direct or indirect relationship with Intention, Heuristics considered had a major influence. Information Asymmetry had an indirect relationship with Intention by modifying the perception of investors either through the Representativeness and Familiarity or through the Market and Company Perception.
Keywords
Initial Public Offers, Perception, Behavioral Intention, Heuristics.
JEL Code: D14, D53, G41.
Introduction
Indian Stock Market, Mechanism of Pricing and Allocation in India
Indian stock market is one of the markets among the developing countries that attract more investors and has also surprised being resilient to major turmoils which is evident from the recent situational factors that affected global markets a large, but not the same extent in our exchanges. Participation of domestic institutional investors is increasing with the increase in investor’s confidence and awareness in our market. Individual investors are becoming more professional in their investment. There is a drastic increase in the number of investors who have opened Demat accounts post 2013 and counting still.
Economic reforms in Indian capital market started in the earlier part of 1990s which was then controlled by CCI Controller of Capital Issues in India. CCI was abolished in the year 1993 and a new regulator Securities Exchange Board of India took over the control of Indian Stock Market. Fixed pricing mechanism was the one widely used during the period with lack of facilities in almost all sector since IT was much developed in India. With the advent of IT, Indian stock market took a shape with introduction of online terminals by NSE which was youngest stock exchange; this welcomed many investors into the stock market. Stock Exchanges started following Book-building method of pricing mechanism and companies are given the choice of either following 100% or 75% Book building methods. In 100% book building methods companies are instructed to provide not less than 25% of total number of shares to retail investors.
Initial Public Offers are widely discussed and researched topic by many of the researchers and experts, Most of them related to the performance of Initial Public Offers with various factors either to measure long term or short term. When it comes to performance it is related to the secondary data available, which were tested with performance as dependent and other factors as independent variables. It is imperative that investor’s to behave rational, but decisions are made from the psychological point of view in many situations attributed to awareness level, availability of information etc., Psychological factors have major influence on decision making.
Thaler (2005) Behavioral finance explains interaction between human and his/her motivation towards investment, either partially or completely influenced by psychological factors. Our proposed research is from behavioural point of view, to know the variables and its strength in deciding the investor’s interest.
Variables for the Study
Literature concentrating on financial behaviour of retail investors specific to Initial Public Offers is limited in India and using of structural equation modelling is rarest in the case of identifying the determinants in case of Retail Investors Intention based on the various perception parameters about the Initial Public Offers. Since the model will have complex relationship between the variables were identified through Structural Equation Modelling (SEM), instead of Regression analysis or Analysis of Variance. SEM has the ability to select an appropriate model among the competing ones, also with validity and reliability measures to test the variables in study. Five factors were considered based on the emerging literature to identify the pattern of relationship between Information asymmetry, Market and Company Perception, Societal Perception, Representativeness and Familiarity, Intention.
Literature Review
Park & Gunther (2007) Receiver’s perception is affected by information w.r.to given behavior by attitude change which in turn finally changes the behaviour of receiver. Abdallah & Hilu (2015) their exist a direct relationship between risk attitude and market perception. Lee (2009) Attitude is the more relevant variable to explain intention. Gopi & Ramayah (2007) all investment activities of individual investors are guided by their attitude. Michael (2011) Individual investors are favourable towards investments in which they are highly motivated and less favourable towards the one that are less motivating. Attitude has evaluative effect on individual feelings towards behavior. Lo & Repin (2001) has studied the psychological characteristics of professional securities traders while they are engaged in live trading. They reported a significant correlation between market events and physiological characteristics. Lawrence (2013) higher quality disclosure of financial part influence investors to take more risk by investing more. Investor’s access to information can influence their perception towards behaviour. Cuong & Jian (2014) Attitude of a person is related to confidence in the issue, familiarity in the issue. Investor Behaviour in any investment decision is seen as a factor of attitude of individual, influence of social norms, information an individual has about the investment and influence of other control variables like market.
Theoretical Underpinnings
Theory of planned behavior considers behavioural intention as an immediate antecedent before the future behaviour. Many researches claim that the intention paves the ways for behavioural performance and increase the chance of behaviour being conducted. In case of stock market investment behavioural intention motivates individual investor’s to make a specific investing decision. Following model was used to determine individual investor behavior by Cuong & Jian (2014) which is a modified Ajzen model of TPB (Figure 1). Since information is the key in making decisions the variable was included in the research to find its relationship and certain variables were either included or excluded to fit according to the investor base for initial public offers.
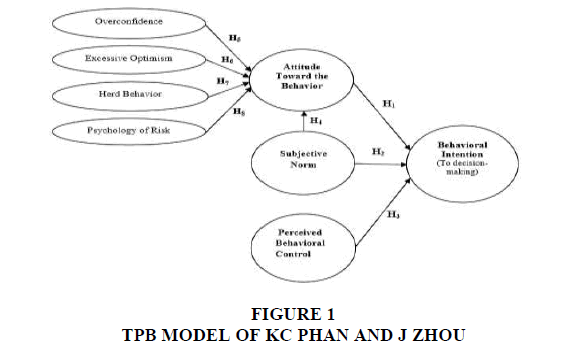
Figure 1: TPB Model Of Kc Phan And J Zhou
Gaps in Literature
1. Most of the studies available are done with the market data available from the technical point of view related to their performance. Performance is assessed either in short or long run based on the return the IPOs provided in the period considered. Our research is aimed at behavioural view not technical.
2. From the behavioral point of view reviews available were huge enough to know about the factors but not the specific items that constitute the factors since most of the reviews were either related to secondary market investment or in the non-financial areas.
3. Most of the research were conducted in developed countries which has opened a arena of discussing from Indian perspective since the penetration level of investment in riskier asset class like shares is lower, of which primary market investment has even lower awareness and penetration.
Objective of the Study
1. To describe the determinants involved in shaping the intentions from behavioral perspective.
2. To develop, validate a structural model with the determinants identified and establish a relationship among themselves and with Intentions.
When it comes to investments there is lot of factors/determinants involved in giving a shape to intention of purchase of a specific security. Securities are generally chosen based on the risk appetite and time horizon an investor considers in the investment preferred. Initial Public Offers as a security considered in the research from the retail investor’s perspective is an option available to make huge return in shorter span of time, discounting all the risk factors in the fresh issue. Investor change their investment behavior and psychology in response to the environment. In a riskier investment like IPO issues it is difficult to say which factor influences, but general factors that influence the intention to purchase can be:
1. Valuation of a security (Pricing of IPO shares).
2. Macroeconomic risk factors (Economic Cycle, Business Cycle, Industry attractiveness, Timing of the issue).
3. Psychological factors like Perception, Attitude, Knowledge of investor (Past experiences, Benchmarks, Proxies considered or Heuristics etc.).
4. Social factors (Family, friends, peers expectations).
Survey instrument is designed to include as many factors/determinants that may influence intention to purchase an untested security (i.e.) Initial Public Offer.
Significance of the Study
1. To Expand the knowledge level and to provide a deeper insight into the area of Initial Public Offers from the retail investors perspective by providing a explanation through behavioural point of view rather than being more technical by the market data.
2. A value addition to the existing research volumes available in Initial Public Offers, provide useful information to retail investors while participating in Initial Public Offer.
Economic Facts during the Period of Study
1. 30 companies went public through IPO and got listed in National Stock Exchange.
2. Average Return on Opening for an IPO during the period was approximately 15%.
3. Average listing day return during the period was approximately 12%.
4. An average Subscription time during the period was approximately 28%.
Participants and the Method
Questionnaire had three parts, questions related to demography, introduction questions related to IPO investment ideas, likert’s scale questions to measure the perception and relationship with intention. Questionnaire was tested with pilot study before administered to research about the study. Data was collected for a period of 9 months in later part of 2016 and earlier part of 2017. Stratified sampling was adopted with Amount of investment as a base since 80:15:5 is approximate investment ratio in Rs 50000, Rs 50001 to Rs 100000 and Rs Rs100001 to Rs200000 respectively. However Purposive sampling was the method adopted while choosing respondents spread over Chennai and other metros. A total of 504 responses were considered for the analysis after the rejection due to multiple reasons.
Analysis And Interpretations
Analysis is done in the following sequence:
1. Investors Profile in the study (To explain the demographic profile of Retail investors in the study and Basic Questions related to an IPO investment) Basic investment behaviour in IPOs are identified in this phase of analysis.
2. Exploratory Factor Analysis (To check whether Factor analysis can be done, To identify the items/variables that get grouped under a particular construct, To name the constructs based on the reviews done) Determinants are identified in this phase of analysis.
3. Confirmatory Analysis (To check whether the identified items and the constructs formed are valid and reliable, to measure the model).
4. Structural Equation Model (To identify the relationship between the construct along with its items/variables with one dependent variable and others considered independent) Strength of the relationship and the direct and indirect influence on dependent variable is identified in this phase.
Investor’s Profile in the Study
Investor as the participant for the research under consideration were those who have prior experience in investing in primary market through Initial Public Offers in three major cities of India namely Chennai, Bangalore and Hyderabad. Reason behind choosing the three cities in the increase in participation of investors from these cities in Indian stock market. Retail investor’s definition as per Indian stock market is those who invest upto Rs 200000. Of this nearly 80% of the investors prefer to invest Rs 50000, 15% beyond Rs 50000 and upto Rs 100000, and 5% beyond Rs 100000 on an average based on the participation in the recent IPOs listed in Indian stock market (Table 1).
| Table 1 Profile Of Respondents To The Study |
||
| Variables | Classification of variables | Percentage |
| Have you invested in any of the recent IPOs (<1yr)? | Yes | 83 |
| No | 17 | |
| How long are you an investor through IPOs? | <2 years | 34 |
| >2 years | 66 | |
| Approximately how much do you invest during initial offer period? | <Rs 50000 | 80 |
| Rs 50001-Rs 100000 | 16 | |
| >100000 | 4 | |
| What is your source of money for investing? | Savings | 76 |
| Borrowed fund | 5 | |
| Sales proceeds from other investment | 19 | |
| Which of the following best describes why you choose to invest in IPOs rather than doing something else with the money? (Multiple option) | To make huge return | 74 |
| To strengthen my portfolio | 20 | |
| To be an initial investor | 48 | |
| How long would you like to hold the stocks purchased through IPO? | Less than a day | 63 |
| Up to my stop loss trigger | 20 | |
| Until I get intended return | 12 | |
| No idea to sell | 5 | |
| If you hadn't purchased shares of a considered IPO, What would have you done with the money? | Spent the money | 10 |
| Invested in other securities | 72 | |
| Purchase same shares in secondary market | 18 | |
| What would be the reason for avoiding an IPO after considering buying it? | Uncertainty about growth | 21 |
| Limited Knowledge | 19 | |
| Priced High | 41 | |
| Other Investment | 19 | |
| What is the most important source of information when making your decision whether or not to invest? (Multiple Option) | Newspapers/Magazines | 45 |
| Offer Document | 42 | |
| Friends or family | 19 | |
| Expert's Research Reports | 23 | |
| Financial Advisor | 16 | |
| Gender | Male | 86 |
| Female | 14 | |
| Age | 20-35 years | 28 |
| 36-50 years | 49 | |
| >50 years | 23 | |
| Occupation | Business | 24 |
| Private sector employee | 37 | |
| Government employee | 39 | |
| Education | Professional | 28 |
| Undergraduate | 31 | |
| Postgraduate | 36 | |
| School level/Diploma | 5 | |
| Annual Income | < Rs 500000 | 37 |
| Rs 500000-Rs 1000000 | 56 | |
| >Rs 1000000 | 7 | |
| Distribution of Investment scale | < Rs100000 | 48 |
| Rs100000-Rs300000 | 37 | |
| >Rs300000 | 15 | |
Source: Primary Data
Following observation were made by comparing the introduction questions along with the demographic variables:
1. When it comes to objective of investment most retail investors prefer IPOs for a higher return and the investment alternative is used to make quick profits, not for a longer term return. Practically and technically through the performance studies of IPOs too most of the IPOs fetched a negative return in long run.
2. Most of the investors preferred to invest in IPOs through the savings money they have and this is maximum among the investors who are in the Investment scale of Less than Rs 100000 and in the less than Rs 50000 category of retail portion subscription. This implies the risk adverse nature of the investors. From the Gender point of view Almost every female in the study made their investment out of the sale proceeds.
3. People at the age category of more than 36 years mentioned their source as savings money and their idea is also to make a quick return on listing.
4. While most of the retail investors prefer to hold on IPO for listing return, the same is maximum among the participants who have investment value of less than Rs 50000. IPOs have a major attraction among the investors category whose annual income is more than Rs 5 lakhs and less than 10 lakhs.
5. Most of the investors prefer to in invest in some other way when they don’t invest in the IPO they have considered to invest. Those who preferred to invest in some other securities have decided to do so mainly because of higher pricing of IPO.
6. Pricing is viewed as a dominating factor when it comes to the reason of not subscribing to an IPO. This proves retail investors have financial awareness in the investment, and this awareness is more among investors who have preferred Offer Document as the important source of information.
Motive of Investors in Investment through IPO
To make huge return is the ultimate motive of any investor and here too there is no exception. Nearly 74% of the investor’s motive behind the investment is to make huge return. Only very investors are interested in IPO to strengthen their portfolio. Also 63% of investors are interested to hold the stocks purchased through IPO less than a day, which implies their motive is to make listing return in the IPO not to hold for a longer term. Charts below (Figure 2) are comparison of demographic profiles with the motive of investing in an IPO based on the responses to how long an investor plans to hold an IPO stock.
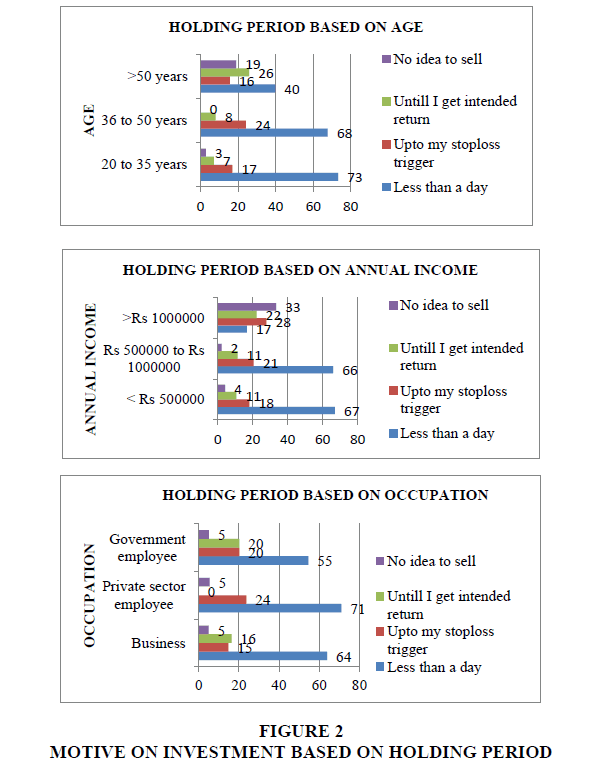
Figure 2: Motive On Investment Based On Holding Period
All the facts are an indication of hot issue period of Primary market, which generally has good response from investors and it’s also evident from the above facts.
Exploratory Factor Analysis
At the starting point of the analysis, questionnaire was constructed with 30 likert’s scale questions to measure the variables of the study; Questions were shuffled to ensure a better outcome. Carried out Exploratory analysis from the variables set.
Strategies that are used as Proxies to Make Investment Decisions
Weighted average of responses is taken as a parameter to decide on the strategies retail investor uses as a proxy in making investment decisions since information asymmetry is prevalent in Indian stock market are listed below:
1. Retail investors feel IPOs managed by top brokers are safer.
2. Institutional and other investor’s interest in an IPO influences decision making.
3. Market share of the company in corresponding industry.
4. Overall economic condition during the IPO issue.
5. Overall market condition during the IPO issue.
6. Number of years the firm in existence.
The Bartlett’s test of sphericity was used to determine the appropriateness of factor analysis by testing the magnitude of the correlations of the entire correlation matrix (Hair et al., 1998). Results from the Bartlett’s test indicated significant correlations among measurement variables considered for the study, which are exhibited in Table 2 below:
| Table 2 Kmo And Bartlett's Test |
||
| Kaiser-Meyer-Olkin Measure of Sampling Adequacy. | .872 | |
| Bartlett's Test of Sphericity | Approx. Chi-Square | 6531.317 |
| df. | 435 | |
| Sig. | 0.000 | |
Source: Primary Data
Kaiser (1974) has recommended KMO value Table 2 of greater than 0.7 is acceptable and if stated value is between 0.7 and 0.7 is good. Value of our test 0.872 confirmed the adequacy of sample size that is considered for the purpose. Significance value of 0.000 indicates existence of relationship between the variables used in the study. Varmax rotation is used in this study since it has higher generalizability and replicability power on comparison with oblique rotation.
SPSS output indicated 5 factors that explained approximately 68% of the total variance in the data set. These five factors are supported by 21 variables and the remaining 9 were not used of factor loadings less that 0.7 or communality lesser than 0.4. Consequently they were names as Information Asymmetry, Market and Company Perception, Societal Perception and “Representativeness and Familiarity”. Other factor is the dependent variable for the research named as Intention.
Confirmatory Analysis
Reliability of Measurement Model
Reliability is a measure of knowing the extent to which data is error free or without bias, has consistency for measure at any time and across various items. In this research to test the items Squared Factor Loadings (SFL) is used. To test reliability of the constructs Cronbach’s Alpha is used. Squared Factor Loadings more than 0.5 is considered as acceptable and Cronbach’s coefficient alpha of greater than 0.7 is acceptable.
Convergent Validity of Measurement Model
Convergent validity is used to know how the items correlate with its own construct. Standardised Regression Weights (SRW) and Average Variance Extracted (AVE) are used to measure the same, SRW>0.70 is used as the criteria to measure the convergent validity. In our case all the items has met the criteria. AVE is calculated through the formula, AVE=i/(i+i), i is factor loading and i is error variance of measured item. Barclay et al. (1975) suggested that an AVE of 0.5 or more indicates satisfactory convergent validity. AVE of all the five constructs satisfies the requirement (Table 3).
| Table 3 Reliability And Convergent Validity |
|||||
| Var No | Constructs | Cronbach's Alpha | SFL>0.5 | SRW>0.7 | AVE>0.5 |
| B1 | Market and Company Perception (MnP) | 0.929 | 0.646 | 0.709 | 0.692 |
| B7 | 0.643 | 0.765 | |||
| C3 | 0.645 | 0.967 | |||
| C8 | 0.635 | 0.949 | |||
| C9 | 0.614 | 0.733 | |||
| A1 | Representativeness and Familiarity (RnF) | 0.913 | 0.496 | 0.700 | 0.615 |
| A3 | 0.594 | 0.919 | |||
| B2 | 0.51 | 0.873 | |||
| B3 | 0.603 | 0.772 | |||
| B10 | 0.605 | 0.693 | |||
| C4 | 0.564 | 0.717 | |||
| A7 | Information Asymmetry (IA) | 0.795 | 0.529 | 0.692 | 0.603 |
| A9 | 0.721 | 0.828 | |||
| A10 | 0.628 | 0.803 | |||
| B9 | Societal Perception (SP) | 0.83 | 0.746 | 0.695 | 0.643 |
| C6 | 0.712 | 0.898 | |||
| C10 | 0.616 | 0.800 | |||
Source: Primary Data
Discriminant Validity of Measurement Model
To measure how the construct is different from other construct to know its unique contribution discriminant validity is done. Correlation between the items is generally used to test this but of overlapping constructs. Fornell & Larcker (1981) suggested that the squared correlations between the constructs should be less than the variance explained by each construct. Table 4 in our case all the items have loaded strongly on its own construct and relatively weak on other constructs and hence the discriminant validity is established.
| Table 4 Discriminant Validity |
||||
| MnP | RnF | IA | SP | |
| MnP | 0.832 | 0.635 | 0.254 | 0.153 |
| RnF | 0.635 | 0.784 | 0.322 | 0.123 |
| IA | 0.254 | 0.322 | 0.777 | 0.184 |
| SP | 0.153 | 0.123 | 0.184 | 0.802 |
Source: Primary Data
Measurement Model
To measure the goodness of fit GFI and AGFI are used. A minimum value of 0.90 for GFI and 0.80 for AGFI is expected by Hu & Bentler (1995). Data for our observations are 0.908 and 0.824 respectively for GFI and AGFI and hence both are acceptable. To measure how bad the model is Chi-Square, RME and RMSEA were used. Segars & Grover (1993) has recommended Chi-square value=0.05, CMIN/DF value of=3, RMR value of=0.09 and RMSEA value of=0.08 as acceptable. In this model the above parameters were read 0.000, 2.505, 0.056 and 0.076 respectively which satisfies the above criteria that the mode is not bad to be rejected (Figure 3).
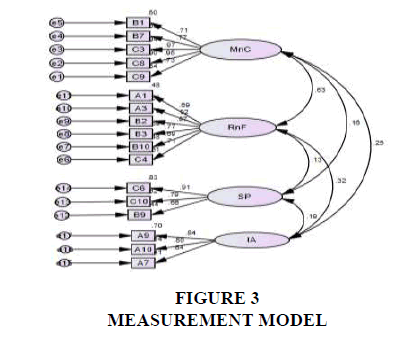
Figure 3: Measurement Model
To measure the goodness of fit on incremental fit indices, Norm Fit Index (NFI) and Comparative Fit Indices (CFI) were used. A Minimum value of >0.9 for both the indices, NFI and CFI have been stated to be acceptable by (Malhotra & Dash, 2011). 0.903 and 0.904 were the measurement in this research which as more that the value required to accept the incremental fit Table 5.
| Table 5 Regression Weights For Structural Model |
|||||||
| Estimate | S.E. | C.R. | P | Label | |||
| MnC | <--- | IA | .182 | .052 | 3.508 | *** | |
| RnF | <--- | MnC | .508 | .066 | 7.747 | *** | |
| RnF | <--- | IA | .109 | .038 | 2.906 | .004 | |
| IT | <--- | RnF | .481 | .104 | 4.607 | *** | |
| IT | <--- | MnC | .161 | .081 | 1.990 | .047 | |
| IT | <--- | SP | .213 | .056 | 3.801 | *** | |
| A1 | <--- | RnF | 1.000 | ||||
| C4 | <--- | RnF | 1.234 | .114 | 10.788 | *** | |
| C8 | <--- | MnC | 1.357 | .092 | 14.794 | *** | |
| B1 | <--- | MnC | 1.000 | ||||
| A8 | <--- | IT | 1.014 | .084 | 12.074 | *** | |
| C6 | <--- | SP | 1.000 | ||||
| B9 | <--- | SP | .734 | .068 | 10.739 | *** | |
| A10 | <--- | IA | 1.000 | ||||
| A9 | <--- | IA | 1.024 | .095 | 10.754 | *** | |
| A7 | <--- | IA | .568 | .059 | 9.558 | *** | |
| C10 | <--- | SP | .925 | .075 | 12.275 | *** | |
| B5 | <--- | IT | 1.047 | .087 | 12.022 | *** | |
| C2 | <--- | IT | 1.000 | ||||
| B10 | <--- | RnF | 1.136 | .109 | 10.436 | *** | |
| B7 | <--- | MnC | 1.081 | .069 | 15.713 | *** | |
| C3 | <--- | MnC | 1.344 | .090 | 15.011 | *** | |
| A3 | <--- | RnF | 1.496 | .110 | 13.553 | *** | |
| B2 | <--- | RnF | 1.436 | .111 | 12.990 | *** | |
| B3 | <--- | RnF | 1.203 | .104 | 11.595 | *** | |
| C9 | <--- | MnC | 1.078 | .074 | 14.646 | *** | |
| C5 | <--- | IT | 1.019 | .037 | 27.838 | *** | |
Structural Equation Model
Assessment of fitness of structural model
Of the several combinations identifies the Model attached below is considered the best, based on the guidelines. Data for our observations are 0.894 (Approx. 0.90) and 0.822 respectively for GFI and AGFI and hence both are acceptable. To measure how bad the model is Chi-Square, RMR and RMSEA were used. Chi Square 0.000<.05,CMIN/DF 2.503<3, RMR 0.063<0.09 and RMSEA 0.077<0.08 satisfies the criteria which implies model is acceptable(Figure 4).
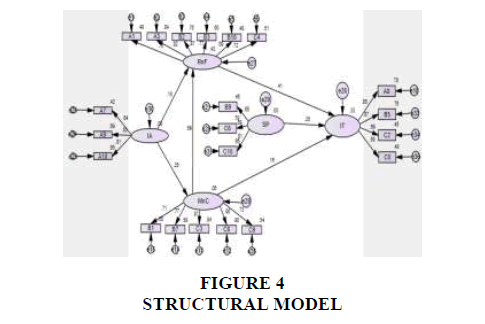
Figure 4: Structural Model
To measure the goodness of fit on incremental fit indices, Norm Fit Index (NFI) and Comparative Fit Indices (CFI) were used. NFI 0.900>0.90 and CFI 0.937>0.90 were the measurement in this research which as more that the value required to accept the incremental fit.
Discussions
The present study has proposed a structural model to understand the intentions of investor’s through various dependent variables that were considered in the research. This is the first of kind empirical study in Chennai and the metros considered. Structural Equation Modelling was employed to understand the relationship. Scales used to measure the construct were identified and refined with best statistical techniques on validity and reliability.
The study makes the valuable contribution; Firstly the study reveals Newspaper and magazines as the important sources of information, Second most investors invest less than Rs 50000 in an IPO issue, thirdly investor’s idea is majorly making quick profits that is inferred through the Major response to Listing Day return, fourthly based on the income category both holding period and amount of investment changes which is directly proportional and finally pricing is the prime reason for avoiding any IPO issue, so the investor’s seems to check for the valuation of a stock.
Information Asymmetry is an important factors influencing and shaping an Investor’s idea about the Perception related to Market/Company and Representativeness/Familiarity. Here the sufficiency of data available to make decisions and the investment banker/brokers credibility are viewed as a better symptom on the IPO issue.
Of the Heuristics considered Familiarity of the company, Familiarity of the issuers business and following the decisions of sources an investor trust (i.e.) Herd Behavior plays a major role in influencing the model.
Among the fundamentals of an IPO issue; Pricing of the issue, Positive trend in the IPO market of Market related considerations and Management practices, Age of the firm of Company related considerations plays a major role in influencing the said construct. Of the societies front the expectations of the family, thinking of the friends/family about the investor’s influences the perception on IPO investment decisions.
Many retail investors consider the IPO investment though many alternatives available to make a better return and had lot of positive things on their IPO investment. Most of invest only in the sub Rs50000 range of investment and to be more specific in they apply only for the minimum lot size.
Penetration of Chennai Investor and the considered metros in Primary market is much lower compared to interest of the region, much attributable to the lack of awareness of the investment option and the risk aversion attitude. Confidence of the investor and the subscription scenario of the institutional investor’s are the dominators in changing the investor attitude which was proven even from the technical point of view by many researchers in analysing performance of Initial Public Offers. Similarly Market and Company attributes which was considered proxy for behavioural Control provided market condition and company management practices as the controlling items indicating positive relationship between attitude and intention.
Conclusion
In the model developed Intention is predominantly influenced by Representativeness and Familiarity of an investor when compared to rest all variables. Market and Company Perception was the most influencing factor upon Representativeness and Familiarity Heuristics. Also Information Asymmetry plays a major role in influencing market/company perception and Heuristics considered. Information Asymmetry indirectly affects the intention to invest through Initial public offers. Other constructs like Representativeness and Familiarity, Market and Company perception, societal perception directly influences in shaping the intention of an investor. Heuristics play a significant role in intention to purchase.
Appendix
Questionnaire Items
| Questions with Likert’s Scale | |
| A1 | I am knowledgeable of primary market activities. |
| A2 | IPOs are well managed through regulations by SEBI. |
| A3 | I am confident of my own opinion over opinion of friends and colleagues. |
| A4 | I usually expect my IPO investment to perform better than other IPO choices available. |
| A5 | I feel regret of a drop in price on listing day of IPO stock I purchased. |
| A6 | Idea of participating in an IPO is appealing. |
| A7 | Data sources available to analyse an IPO is plenty now-a-days. |
| A8 | It is very likely that I consider IPO investment though there are other investment options. |
| A9 | When I feel the data available is sufficient, reliable I feel safer. |
| A10 | When IPO is managed by top brokers its safer. |
| B1 | Pricing of an IPO influences my decision on IPO. |
| B2 | Institutional and other investors’ interest on an IPO influences my decision to invest. |
| B3 | Popularity of company's group influences my participation in that IPO. |
| B4 | Expectations of my family influence me to take risk on an IPO. |
| B5 | I have many positive things to express in my prior IPO investments. |
| B6 | Position of IPO company in corresponding industry influences my idea of participation |
| B7 | Success of IPO's prior to current IPO influence my decision. |
| B8 | My past experiences influence my decision making. |
| B9 | My friends/family confidence on my ability to select winner IPOs influences my participation. |
| B10 | I imitate decision of others when deciding an IPO. |
| C1 | When overall economy is better, I feel IPOs are safer to invest. |
| C2 | I have intention to invest in a good forthcoming IPO. |
| C3 | With a good market condition, I can get better return on IPOs. |
| C4 | When the business of issuer is familiar, IPO can be considered less risky. |
| C5 | I recommend my friends the IPO which could fetch better return. |
| C6 | When my family approves my risk taking behavior, it increases my confidence. |
| C7 | When I feel my IPO investment can provide better return than secondary market I feel safer. |
| C8 | When the company has better management practice, I can take a calculated risk. |
| C9 | With the age of firm, I can predict credibility of company. |
| C10 | Most people who are important to me think that is should invest in IPO. |
References
- Abdallah, S., & Hilu, K. (2015). Exploring determinants to explain aspects of individual investors’ financial behaviour. Australasian Accounting, Business and Finance Journal, 9(2), 4-22.
- Cuong, P.K., & Jian, Z. (2014). Factors influencing individual investors’ behavior: An empirical study of the Vietnamese stock market. American Journal of Business and Management, 3(2), 77-94.
- East, R. (1993). Investment decisions and the theory of planned behaviour. Journal of Economic Psychology, 14(2), 337-375.
- Fornell, C., & Larcker, D.F. (1981). Structural equation models with unobservable variables and measurement error: Algebra and statistics. Journal of Marketing Research, 382-388.
- Gopi, M., & Ramayah, T. (2007). Applicability of theory of planned behavior in predicting intention to trade online: Some evidence from a developing country. International Journal of Emerging Markets, 2(4), 348-360.
- Harrison, D.A., Mykytyn, P.P., & Riemenschneider, C.K. (1997). Executive decisions about adoption of information technology in small business: Theory and empirical tests. Information Systems Research, 8(2), 171-195.
- Hu, L.T., & Bentler, P.M. (1995). Evaluating model fit. Structural equation modelling: Concepts, issues and applications, 77-99.
- Kaiser, H.F. (1974). An index of factorial simplicity. Psychometrika, 39(1), 31-36.
- Lawrence, A. (2013). Individual investors and financial disclosure. Journal of Accounting and Economics, 56(1), 130-147.
- Lo, A.W., & Repin, D.V. (2002). The psychophysiology of real-time financial risk processing. Journal of Cognitive Neuroscience, 14(3), 323-339.
- Mahoney, M.L. (2011). An examination of the determinants of top management support of information technology projects. ProQuest LLC.
- Malhotra, N.K. & Dash, S. (2011). Marketing research: An applied orientation . Pearson education.
- Paek, H.J., & Gunther, A.C. (2007). How peer proximity moderates indirect media influence on adolescent smoking. Communication Research, 34(4), 407-432.
- Ramayah, T., & Suki, N.M. (2006). Intention to use mobile PC among MBA students: implications for technology integration in the learning curriculum. UNITAR e-Journal, 2(2), 30-39.
- Rouibah, K., Thurasamy, R., & May, O.S. (2009). User acceptance of Internet banking in Malaysia: Test of three competing models. International Journal of e-Adoption (IJEA), 1(1), 1-19.
- Segars, A.H., & Grover, V. (1993). Re-examining perceived ease of use and usefulness: A confirmatory factor analysis. MIS Quarterly, 517-525.
- Thaler, R.H. (2005). Advances in Behavioral Finance.