Research Article: 2018 Vol: 22 Issue: 6
An Empirical Study on the Effect of Gross Domestic Product on Inflation: Evidence Indian Data
JK Raju, Davangere University, India
Manjunath BR, Bapuji Institute of Engineering and Technology-MBA, Davangere, India
Rehaman M, IHS Markit, Bangalore, India
Abstract
The study focuses on the effect of Gross Domestic Product and inflation. It is been believed that increase or decrease in inflation rate will develop an economy of the country. The data has been used for the period of 1992 to 2017. This empirical analysis used Unit root test, Co-integration test, Granger causality test and Vector correction model. There is long-run positive and negative significance between economic growth and inflation. The increase of GDP will help to increase in growth of economy and Inflation will react to an economy.
Keywords
Economic Growth, Inflation, Unit Root Test, Co-integration Test, Granger Causality.
Introduction
The relationship between economic growth and inflation is one of the major important macroeconomic factors of India. As inflation refers to increase in the prices of the economy and that determinates of inflation is main important in building economic forecast in planning models and in several sectors although that changes from one to another country. This leads to falling in purchasing power/currency value, High inflation will slightly affect the economic performance, zero inflation is also harmful to different sectors of the economy, moderate inflation is better for the economic growth and even decrease in inflation is also unsafe for the rate of employment and high output. If there is the right level of economic growth can be achieved through the right level of inflation.
Consequently, economic growth is affected by its effects saving and investment. One of the key issues examined in macroeconomics is the impact of inflation on productivity, growth, and output. The growth focuses on the inflation effects on the stable state equilibrium of per output and capital. Inflation and economic growth will be changing from one country to another country.
The Gross Domestic Product (GDP) growth is the measure of national income and output for a specified country’s economy. It is the measure of total expenditure for all final value of services and goods that have been manufactured in a country within a stipulated time frame. GDP targets to best capture the monetary value of a country’s economy. To accelerate economic growth to eliminate poverty and unemployment and ensure environmental sustainability and quality of life. India has objected to endure high economic growth with less inflation. There has been a significant dispute in macroeconomic on the presence and there is the relationship with nature of inflation and economic growth.
GDP growth in recent years, an average of 6.275% in 2017, down from 7.10 percent in 2016, this region has faced many challenges and issue in an economy. Similarly, inflation is an average 2.35% in 2017, down from 4.94% in 2016. The low inflation of consumer prices has been varying and encountered many challenges. There is the likelihood of the presence of an undesirable relationship between Inflation and GDP growth has led to the occurrence of the issue of causality. Does increasing level of Inflation drive sustainable economic growth, or does rapidly growing domestic economy attract more Inflation?
Literature Review
There are a couple of reasons for swelling where total request rises quicker than total supply, in this manner expanding the cost of products and ventures. The unevenness of total request and supply is related with government's deficiency, extension of bank's loan fees and increment of outside request.
Sarel (1997) attempts an alternative empirical investigation of the problem and also concludes that inflation affects growth only if it breaches a specific “threshold” rate of inflation but not otherwise. He concludes that an inflation threshold of about 8% for a pooled sample of a large number of countries, including India, serves as a good common benchmark for the sample as a whole. Since the common threshold is an estimate from a pooled sample, it may not be exactly suitable for a particular country if taken in isolation. There is, therefore, a need to have yet another empirical assessment of the problem of finding the level at which inflation actually begins to erode economic growth in given economy.
Thinking about the impact of swelling on financial development, Hossain et al. (2012) place that other than high expansion level which compels monetary execution or zero expansion that really stagnates it, gentle (single digit) expansion rate is sine qua non for financial thriving. Disregarding that the issue postured by expansion is a worldwide marvel since it cuts crosswise over both created and rising economies; in this way, its control remains a "bad dream" to monetary policymakers all through the world. These days in Nigeria, concerns have been raised over the diligent ascent in swelling rate with chaperon disintegrating of estimation of naira and general value shakiness. In such manner different researchers hold various perspectives on expansion and development relationship some of which are condensed beneath.
Barro (2013) watches that the seriousness of expansion on development in the short run is irrelevant, yet antagonistically influences expectations for everyday comforts. Similarly, Kasidi and Mwakanemela (2013) contend that swelling negatively affects development focusing on that there is no long run association with development. Moreover, Bruno and Easterly (1998) insist that development decreases altogether amid high expansion periods, including that swelling in any case advances development when its rate is at bring down levels. This implies high swelling does not advance development; it influences financial development contrarily in the wake of accomplishing a specific limit (i.e. the level at which impact starts).
Jones and Manuelli (2001) follow hush in monetary exercises cum development to inflationary weights, which show in a few regards: squander in time and assets by people and organizations while attempting to defend their riches from expansion. This wonder likely realizes wasteful portion of generation assets with a general decrease in macroeconomic execution. Additionally, diminished reserve funds achieve diminished ventures, which eventually lessen development level. General vulnerability about future value levels debilitates venture and likely lower capital arrangement in the economy. Also, the profits on ventures are decreased by swelling; therefore financial specialists may put resources into here and now capital as opposed to making long haul speculations. Financial specialists would rather put resources into resources that can support against expansion (property, value) rather than profitable resources such plant and gear (Jones and Manuelli, 2001). This may additionally debilitate the generation limit of the economy, ceaseless work transactions squander assets and ascend in ostensible wages bringing about ineffectiveness and lower development.
Ambler (2003) places that higher expansion demoralizes intensity in global exchange with exchanging accomplices, influencing send out import exchanging relations, in this manner bringing about disequilibrium to be determined of installments in type of a present record shortage. Diminished outside trade limit in any economy after some time will constrain a nation's capacity to upgrade its present record shortage. Moreover, with the casual rivalry in global markets, benefits gathering to stock part will diminish. Fundamentally, assets will move far from the stock part into the non-stock segment. Expansion downplays the genuine estimation of devaluation (i.e. the sum or rate by which products or administrations diminish in an incentive after some time, typically one year). For this situation, higher benefits are pronounced bringing about higher assessment paid on benefits. This circumstance is probably going to be troublesome to organizations craving to make extra speculations.
Consider an economy where an individual parts his riches into two sections, specifically: capital stock and cash. Obviously cash is reserved for utilization and speculation. A higher swelling level could bring about diminished utilization rate, while speculation may increment since venture, ceteris paribus, gets a higher return. Nonetheless, with the low profit for cash, the net return turns out to be low, and as a result of that venture and capital stock level drop. In outcome, financial development drops by virtue of lower utilization, bring down speculation and lower capital stock. Amid higher inflationary weights, there are likely results: First is an expansion in the development rate in light of the fact that, as devaluation rises, the duty paid on capital is lessened. Also, there is a diminishing in development rate.
Research Gap
From the literature review, it is observed that the research has to be conducted in the Indian context to understand and study the effect of Gross Domestic Product (GDP) on inflation. The various studies infer that there is a significant relationship between the GDP and inflation and hence the researchers decided to identify and spot the effect towards the variables by adopting econometrics tool, specifically, Granger causality test which includes vector error correction model to analyze short run and long run causality relationship. As there are different macroeconomic factors affects the growth of GDP, however, it is often considered that inflation is a cause and effect for GDP growth in India and it is required to study reason behind where the effect of GDP will lead to increase or decrease of inflation.
Objectives
1. To evaluate the dynamics of short-term linkages between Inflation and economic growth GDP.
2. To explore the occurrence of long-term equilibrium relationship between Inflation and economic growth GDP
3. To apprehension the linear inter-dependence among the variables under study in the Indian context.
Research Motivation
The inflation and GDP are considered to be an economic indicators, the 25 years data has been collected and analyzed using Eviews software. The detailed study of independent variable GDP with dependent variable Inflation and check out with significance level.
Research Methodology
The economic policy of liberalization was introduced in 1991. At the period of introducing the new economic policy that economy has met double-digit inflation and new economic policies will be attentive controlling double-digit inflation. Even the new government has proposed in thrived down inflation. The study will discuss the relationship between inflation and economic growth. The analysis was established on time series from 1992 to 2017 with 23 years of annual observation and secondary data sourced primarily from the World Bank. Data were collected and were analyzed by applying economic tools and techniques from the use of E view statistical package. The comprised of data testing with testing the stationary of data using graphical analysis that are combined with the Augmented Dickey-Fuller (ADF) Unit Root Test Method and co-integration test were in-between GDP growth rate inflation. Johansen's was familiar and proceeding towards analysis of the causal relationship between GDP and inflation. GDP by administering the Granger Causality upon authorization of variables being cointegrated.
• Sample Size: 23 years observation.
• Source of the data: World Bank, International Monetary Fund.
• Type of data: Secondary data.
Hypothesis
These hypotheses were implemented to attain the objective of the study.
H1: GDP has a unit root.
H2: Inflation growth rate has a unit root.
H3: There is no co-integration between GDP and Inflation.
H4: GDP growth does not Granger-cause Inflation.
H5: Inflation does not Granger-cause GDP growth.
Results And Discussion
Graphical Analysis
The first impression obtained from Figures 1-3 is that both GDP growth rate and inflation appears to be too much volatile during the period 1992 to 1999. The year 2000 witnessed sharp fall in the rates and then some consolidated phase is witnessed during 2000 to 2006. The GDP growth rate averaged 6.83% during the period 1992 and 2017. Similarly, between 1992 and 2017, the inflation averaged 7.24%, which raises doubts about stationary or non-stationary of both series, hence further tests had to be conducted.
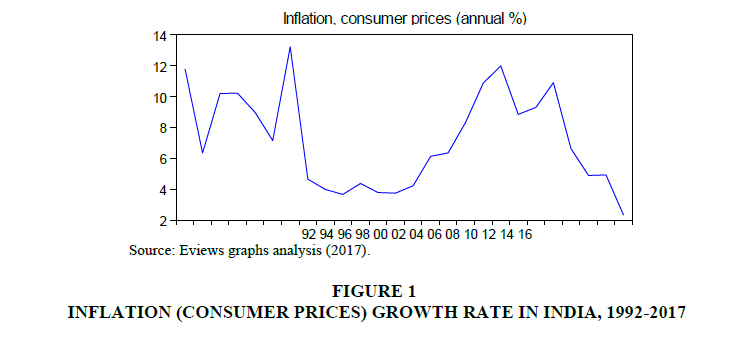
Figure 1: Inflation (Consumer Prices) Growth Rate In India, 1992-2017
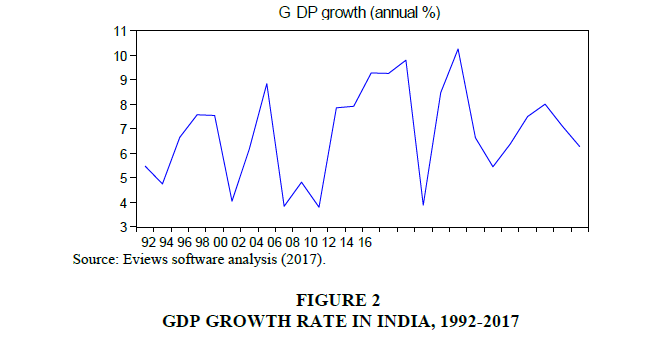
Figure 2: GDP Growth Rate In India, 1992-2017
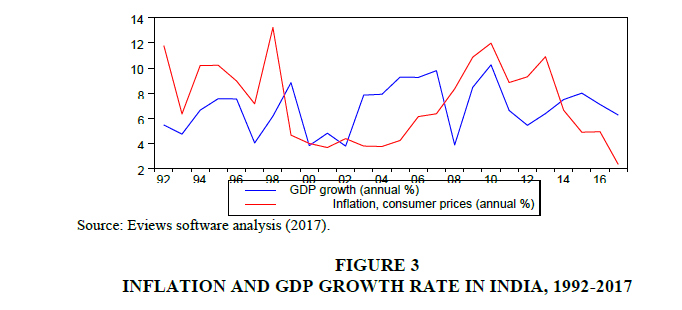
Figure 3: Inflation And GDP Growth Rate In India, 1992-2017
Unit Root Test
Table 1 shows the results of the ADF Unit Root Test for Inflation and GDP. The results depict that the null hypotheses H1 and H2 that Inflation and GDP have unit roots can be rejected since the critical t-value is less than 0.05 respectively at first difference (I (1)) at 5 percent significance level. For inflation, the t-value is -7.1475, which is lower than the computed ADF critical value (-2.9919) at 5 percent level of significance.
| Table 1 ADF Unit Root Test For Inflation And Gdp Growth In India, 1992-2017 |
||||||||
| Particulars | Inflation | GDP growth | ||||||
| t-statistics | Critical Value | P-value | t-statistics | Critical Value | P-value | |||
| At level | -3.1293 | 1% | -3.7880 | 0.0396 | -4.1065 | 1% | -3.7241 | 0.0041 |
| 5% | -3.0124 | 5% | -2.9862 | |||||
| 10% | -2.6461 | 10% | -2.6326 | |||||
| At first difference | -7.1475 | 1% | -3.7379 | 0.0000 |
-5.5192 | 1% | -3.7529 | 0.0002 |
| 5% | -2.9919 | 5% | -2.9981 | |||||
| 10% | -2.6355 | 10% | -2.6388 | |||||
Source: Eviews software analysis results (2017).
Similarly, in case of GDP, the t-value is -5.5192 which is also smaller to the calculated ADF critical value (-2.9981) at 5 percent level of significance. It was therefore concluded that Inflation and GDP time series do not have unit root problem and the data good enough to proceed to co-integration test.
Johansen’s Co-Integration Test
Table 2 presents the results of the JCiT which was conducted to establish whether there was any long-run equilibrium between Inflation and GDP in India over the sample period 1992- 2014. The null hypothesis (H3): there is no co-integration between Inflation and GDP growth, is rejected at 5 percent level significance since p-value (0.0376) is lower than 0.05. Moreover, the trace statistic indicates one co-integrating equation at 5 percent significance level; this is evidenced by the p-value (0.1541) which is greater than .05, which leads to the acceptance of the alternative hypothesis that there is no co-integration between Inflation and GDP growth.
| Table 2 Results Of Johansen Co-Integration Test On Inflation And Gdp Growth Time Series In India, 1992-2017 |
|||||
| Co-integration Test |
Level | Max.Eigen Value |
t-statistic | C.V. at 5% |
Probability |
| Trace Test | H0: r=0 (none)* | 0.4484 | 16.3086 | 15.4947 | 0.0376 |
| H1: r ≤ 1 (at most 1) | 0.0811 | 2.03074 | 3.84147 | 0.1541 | |
| Max. Eigen | H0: r=0 (none)* | 0.4484 | 14.2778 | 14.2646 | 0.0498 |
| H1: r ≤ 1 (at most 1) | 0.0811 | 2.03074 | 3.84147 | 0.1541 | |
Note: Trace test and Maximum Eigen test indicate 1 Cointegration equation at the 0.05 level*denotes rejection of the hypothesis at the 0.05 significance level.
Source: Eviews software analysis results (2017).
Also, the results of Johansen co-integration test as presented in Table 2 exhibit that the trace statistic for the calculated Max-Eigen value (16.3086) is more than its critical value (15.4947) indicating that variables are bound together by long-run equilibrium relationships and follow a long run path, also it depicts the absence of co-integration between variables in confirmation of the null hypothesis (H3). Similarly, the Max-Eigen test confirms the absence of long-run co-integration between the two-time series, since Max-Eigen t-statistic value (14.2778) is greater than its critical value (14.2646) at 5% level of significance.
Nonetheless, further results of Johansen co-integration test denote that the null hypothesis H3: there is no co-integration between the Inflation and GDP is rejected at 5 percent level of significance since trace test and Maximum Eigen test indicate at most 1 co-integration equation at the 0.05 level. Therefore, it leads to the acceptance of alternative hypothesis that there is co-integration between Inflation and GDP growth rate in India.
Vector Error Correction Model (VECM)
Since some co-integration between Inflation and GDP growth in India was empirically established, the next level of analysis involved fitting the series into a VECM and the results, as shown in Table 3 based on the first normalized eigenvector, indicates the presence of long-run relationship between Inflation and GDP. The estimated co-integrating co-efficient for the GDP growth is as follows:
| Table 3 Co-Integrating Vector Of Inflation And Gdp Growth In India, 1992-2017 |
||
| Co-Integrating Equation | ||
| Inflation | GDP | Constant |
| 1.0000 | -41.46894 | 283.3505 |
| (10.9205) | ||
| [-3.79735] | ||
| Note: Standard errors in ( ), and t-statistics in [ ] | ||
Source: Eviews software analysis results (2017).
L Inflation=-6.832838 -0.024114GDP [-0.1916]
As shown in Table 4, the lower t-statistic value of -3.18151 and 1.16146 respectively are both less than the critical value (1.96) at 5 percent significance level, thus evidencing the absence of long-run equilibrium relation between GDP and Inflation as far as the Indian context is concerned. Thus, it could be inferred that the value of next year’s GDP is not necessarily influenced by the current year's Inflation at 95 percent confidence level. From the VECM result, it is evident that Inflation has no significant long-run negative impact on economic growth of Indian economy.
| Table 4: Long Run Causality | ||||
| Coefficient | Std. Error | t- Statistic | Prob. | |
| 1 | -0.013692 | 0.011789 | -1.16146 | 0.2615 |
| C | -0.357435 | 0.229588 | -1.556852 | 0.1379 |
| C | -0.036355 | 0.230058 | -0.158025 | 0.8763 |
| C | -0.76796 | 0.366103 | -2.097663 | 0.0512 |
| C | -0.497033 | 0.301708 | -1.647399 | 0.1178 |
| C | -0.24146 | 0.556148 | -0.434165 | 0.6696 |
System Equation
D (INFLATION)=C (1)*(INFLATION (-1)-41.4689350584*GDP (-1)+283.350530732)+(2)* D (INFLATION (-1))+C (3)*D (INFLATION (-2))+C (4)*D (GDP (-1))+C (5)*D (GDP (-2)) + C (6)
D (GDP)=C (7)*(INFLATION (-1)- 41.4689350584*GDP (-1)+283.350530732)+C (8)*D (INFLATION (-1))+C (9)*D (INFLATION (-2))+C (10)*D (GDP (-1))+C (11)*D (GDP(-2))+C (12)
Dependent Variable: D (INFLATION)
Method: Least Squares
Date: 01/25/18 Time: 18:24
Sample (adjusted): 1995 2017
Included observations: 23 after adjustments
D (INFLATION)=C (1)*(INFLATION (-1)-41.4689350584*GDP (-1)+283.350530732)+C (2)*D (INFLATION (-1)) + C (3)*D (INFLATION (-2))+C (4)*D (GDP(-1)) + C (5)*D (GDP (-2))+C (6)
R2 0.309400
Mean dependent variable -0.341804
C (1) is significant because it is less than 5% and the coefficient is negative. There is a long run Causality running from Imports Goods and Services to GDP. C (1)=Speed not adjustment towards long-run equilibrium but it must be significant (significant is negative) and then there is no long Run causality. R square is more and F statistics are significant.
Short Run Causality
C (4) and (5)=0 is null hypothesis
Walt statistics to check Inflation and GDP C (4)=C (5)=0 hence there is a short run causality running from inflation to GDP, Probability is less than 5% (Tables 5 & 6). Therefore,
| Table 5 Wald Test |
|||||
| Equation: Untitled | |||||
| Test Statistic | Value | df | Probability | ||
| F-statistic | 2.314099 | (2, 17) | 0.1292 | ||
| Chi-square | 4.628198 | 2 | 0.0989 | ||
| Null Hypothesis: C (4)=C (5)=0 Null Hypothesis Summary: | |||||
| Normalized Restriction (=0) | Value | Std. Err. | |||
| C (4) | -0.767960 | 0.366103 | |||
| C (5) | -0.497033 | 0.301708 | |||
| Table 6 Inflation And Gdp Growth In India, 1992- 2017: Co-Integrating Vector Error Correction Estimates |
||
| Error Correction: | D(GDP growth) | D(INFLATION) |
| CointEq1 | -1.068744 | 0.567805 |
| (0.33592) | (0.48887) | |
| [-3.18151] | [ 1.16146] | |
| D(GDP_GROWTH(-1)) | 0.173599 | -0.76796 |
| (0.25156) | (0.36610) | |
| [ 0.69008] | [-2.09766] | |
| D(GDP_GROWTH(-2)) | 0.160865 | -0.497033 |
| (0.20732) | (0.30171) | |
| [ 0.77594] | [-1.64740] | |
| D(INFLATION(-1)) | 0.426167 | -0.357435 |
| (0.15776) | (0.22959) | |
| [ 2.70138] | [-1.55685] | |
| D(INFLATION(-2)) | 0.097557 | -0.036355 |
| (0.15808) | (0.23006) | |
| [ 0.61713] | [-0.15802] | |
| C | 0.003352 | -0.24146 |
| (0.38215) | (0.55615) | |
| [ 0.00877] | [-0.43417] | |
| Note: ( ) error term [ ] t-value. | ||
Source: Eviews software analysis results (2017).
• There is a long run causality running from GDP to Inflation.
• There is a short run causality running from GDP to Inflation.
This results Granger causality test are presented in Table 7. It seems that there is no causality between GDP growth and Inflation, and vice-versa. In other words, Inflation does not Granger cause economic growth and economic growth does not Granger-cause Inflation in the Indian Context. This result appears to be contrary to the bi-directional findings by Egbetunde (2012), although it is pertinent to note that Egbetunde (2012) used total economic growth for analysis the analysis rather than Inflation.
| Table 7 Granger Causality Test Are Presented |
||||
| Null Hypothesis | Observation | F-Statistic | Probability | Decision |
| Inflation does not Granger Cause GDP | 24 | 3.21665 | 0.0626 | Accept |
| GDP does not Granger Cause Inflation | 24 | 1.20075 | 0.3228 | Accept |
Source: Eviews software analysis results (2017).
The null hypothesis H4: GDP growth does not Granger-cause inflation is accepted as the probability value (0.3228) is greater than 0.05 required significance level. Similarly, the null hypothesis H5: Inflation does not Granger-cause GDP growth is accepted as the probability value (0.0626) is also greater than 0.05 required significance level. This means that to a significant extent, GDP growth does not necessarily have to attract or lead to increasing levels of Inflation. Similarly, GDP growth rate is not Granger-caused by inflation and thus the value of inflation cannot be used to predict future GDP.
Conclusion
This paper concludes that there is an absence of causality between inflation and GDP and with use of time series analysis. The empirical demonstrate there is an existence of the statistically significant long-run negative relationship between economic growth and inflation as there is a significantly long run negative relationship successively from GDP to inflation. Since inflation does not affect economic growth of the country, the objective should be to focus on economic growth development. Inflation may be due to the demand side and supply side factors. The lead of inflation will be of international factors and monetary factors. Based on conditions, the government has been taking suitable measures to control inflation to maintain economic stability in the country.
Summary and Findings
The inflation and GDP of annual time series from 1992 to 2017. After assessing stationarity of the inflation and GDP growth and accompanying sequence of econometric test to determine causality and co-integration. The below following are major findings occur from this study.
1. Both Inflations and GDP are stationary based on Augmented Dickey-Fuller (ADF) test.
2. The trace test under Johansen Co-integration method indicates one co-integrating equation at 5% level of significance.
3. From the VECM results, it is evident that Inflations has no significant long-run negative impact on economic growth of Indian economy.
4. The Granger causality test results showed that Inflations and GDP growth are mutually not correlated in an Indian context.
Suggestion
Further, the policymakers should take note of that any expansion in inflation from the past period at any level has the negative impact on economic growth. The government needs to control budget deficits that will encourage growth and possess inflation low. Inflation drives any economy and hence policy maker’s decision on fixing inflation rate will result in better economic development.
References
- Agarwala, R. (1970). An econometric model of India.
- Ahluwalia, I.J. (1979). Behaviour of prices and output in India: A macro-economic aggregates. RBI Occasional Papers.
- Ambler, S., & Cardia, E. (1997). Testing the link between inflation and growth. In Proceedings of the conference on price stability, inflation targets, and monetary policy. Ottawa: Bank of Canada.
- Barro, R.J. (1995). Inflation and economic growth. NBER Working Paper, Cambridge.
- Bhattacharya, B.B (1985). Public expenditure, inflation, and growth: A macro-economic analysis for India. Oxford University Press, New Delhi. Economic and Political Weekly April 21, 1990, 851
- Bruno, M., & Easterly, W. (1998). Inflation crises and long-run growth. Journal of Monetary Economics, 41, 3-26.
- Fischer, S. (1993). The role of macroeconomic factors in growth. NBER Working Paper.
- Ghosh, A., & Phillips, S. (1998). Inflation, disinflation, and growth. IMF Working Paper, Washington, DC: International Monetary Fund.
- Ghosh, A., & Phillips, S. (1998). Warning: Inflation may be harmful to your growth. IMF Staff Paper, 45(4), 672-710.
- Gokal, V., & Hanif, S. (2004).The relationship between inflation and economic growth. Economics Department, Reserve Bank of Fiji, Suva, Fiji, Working Paper.
- Jones, L.E., & Manuelli, R.E. (1993). Growth and the effects of inflation. NBER Working Paper.
- Khan, M.S. (2002). Inflation, financial deepening, and economic growth. IMF Paper for Banco de Mexico Conference on Macroeconomic Stability, Financial Markets and Economic Development.
- Krishnamurthy, K. (1985). Inflation and growth: A Model for India' in Krishnamurthy and Pandit. Macro-Econometric Modeling of the Indian Economy, 39-42.
- Krishnamurty, K. (2002). Macroeconomic models for India: Past, present and prospects. Economic and Political Weekly, 37(42).
- Narasimham, G.V.L., & Agarwal, R. (1972). An econometric model of India 1948-61. Econometrica, 40, 975.
- Pani, P.K. (1984). A macro model of Indian economy with special reference to output, demand, and prices (1969-70 to 1981-82). Reserve Bank of India Occasional Papers, 5, No 2, December
- Sahadudhhen. (2012). A co-integration and error correction approach to the determinants of inflation in India. International Journal of Engineering Research, 105-112.
- Sarel, M. (1996). Nonlinear effects of inflation on economic growth. IMF Working Staff Papers, 43(1), 199-215.
- Smyth, D.J. (1994). Inflation and growth. Journal of Macroeconomics, 16, 261-270.
- Sidrauski, M. (1967). Inflation and economic growth. Journal of Political Economy, 75(6).