Research Article: 2021 Vol: 25 Issue: 5
A Study on Performance Evaluation of Private Sector-Banks: Pre-Covid Crisis
Dr. Anju Bala, Mangalmay Institute of Management and Technology
Dr. Pooja Goel, Mangalmay Institute of Management and Technology
Mr. Rajnish Kumar Mishra Rohit, Mangalmay Institute of Management and Technology
Abstract
The banking sector plays an efficient role in economic development of a country. Banks are considered as back bone of any economy for financial growth and stability. Private sector banks in India play an important role along with public sector for overall financial sector reforms. The introduction of multinational private sector banks in India increased the competition in Indian Banking Industry. The objective of this study is to evaluate and analysis the performance of private banks before Covid Pandemic. Required secondary data has been collected from annual reports of the respective banks and Reserve Bank of India website. Current study covered a period of 10 years from financial year 2010- 2011 to financial year 2019-2020. Current study is based on the performance of five selected private sector banks, namely-HDFC, ICICI, Axis bank, KOTAK Mahindra bank, and IDFC bank. CAMEL method is used for measuring the financial performance of these banks. To evaluate the performance of private sectors banks, five critical elements are used i.e., Capital adequacy ratio, asset quality, management, earning and liquidity.
Keywords
Asset Quality, CAMEL, Capital Adequacy, Covid Pandemic, Earning, Liquidity, Management.
Introduction
Banking in India frames the base for the monetary development of the nation. Significant changes in the banking framework and the executives have been seen throughout the years with the advancement in innovation, considering the necessities of individuals. The History of Banking in India started before India got independence in 1947. The “Bank of Hindustan” was the first Indian Bank which was established in 1770 in the Calcutta. During the Pre Independence period over 600 banks had been registered in the country, but only a few managed to survive. In the British rule era, they established three banks namely the Bank of Bengal, Bombay and Bank of Madras and called them the Presidential Banks. These three banks were later merged into one single bank in 1921, which was called the “Imperial Bank of India.” The Government chose to nationalize the Banks during post-independence period. Reserve Bank of India was nationalized in 1949 while Imperial bank was nationalised as State Bank of India during 1955. 14 banks were nationalized in 1969 and 6 banks were nationalised in 1980. After 1991 (Liberalization Period), the Government chose to encourage private banks in Indian banking industry (Gupta, 2014).
Private sector banks are banking organizations with higher stakes or value being held by private investors and not the Government of India. In 1991, the Narasimhan Committee laid attention on the significance of sound competition in the financial sector, which had been missing in the post nationalization period and thus, unambiguously upheld for the passage of private and unfamiliar financial organizations in the Indian market. With RBI's advancement strategy in the 1990s, the private sector banks rise once more. In India, they have been sorted into two kinds by the monetary controllers; Old Private Sector Banks (arose before 1968) and New Private Sector Banks (arose after 1968). The Old private sector banks had been excessively little in 1969 to be remembered for the nationalization and thus protected their autonomy. As of now, there are 22 private sector banks in India. The old private banks are more modest in size and more territorial in nature contrasted with the new ones. Private Banks are substantially more careful about opening new branches. Name of Private Banks in India.
1. Axis Bank, 2. Bandhan Bank, 3. HDFC Banks, 4. Dhanlaxmi Bank, 5. Federal Bank, 6. ICICI Banks, 7. Kotak Mahindra Bank, 8. IDFC FIRST Bank, 9. Jammu & Kashmir Bank, 10. IndusInd Bank, 11. Karnataka Bank, 12. Karur Vysya Bank, 13. Lakshmi Vilas Bank, 14. Nainital bank, 15. RBL Bank, 16. South Indian Bank, 17. Tamilnad Mercantile Bank, 18. YES Bank, 19. IDBI Bank, 20. DCB Bank, 21. City Union Bank and 22. CSB Bank.
Literature Review
Mohi-ud-Din; Nazir, (2010) stated that sound financial health of a bank is the guarantee not only to its depositors but is equally significant for the shareholders, employees and whole economy as well. In this paper, an effort has been made to evaluate the financial performance of the two major banks operating in northern India. This evaluation has been done by using CAMEL Parameters, the latest model of financial analysis. Through this model, it is highlighted that the position of the banks under study is sound and satisfactory so far as their capital adequacy, asset quality, Management capability and liquidity is concerned.
Anurag & Priyanka (2012) conducted a comparative study of financial performance between SBI and ICICI bank. The purpose of the study is to evaluate the financial performance of SBI (Public sector bank) and ICICI Bank (private sector bank. This study was descriptive and analytical in nature. Researcher conducted this study to compare the financial performance of SBI and ICICI Bank on the basis of various ratios such as credit deposit, net profit margin etc for the period of five years (2007-08 to 2011-12). This study expressed that loan assets from deposits are higher in case of ICICI than SBI. The researcher found that SBI is performing well and financially sound than ICICI Bank other than deposits and expenditure (Debnath & Shankar, 2008).
Ruchi (2014) has evaluated the performance of public sector banks in India using CAMEL model. Like other sectors, banking sector plays a very important role for development of economy. Banking sector helps in capital formation, innovation and monetization in addition to facilitation of monetary policy. It is essential to evaluate and analyse the performance of banks to ensure a healthy financial system and an efficient economy. This study evaluated the performance of public sector banks in India using CAMEL approach for a five year period (2009-2013). Researcher found that the overall performance of public sector banks is different from year to year (Shah, 2015).
Srivatstava, et al. (2015) conducted a study to Analysis the performance of Indian Banks – A Comparative Study. Authors evaluated the comparative study on some selected banks with reference to some selected parameters. The descriptive and conclusive research designs were used by the researcher during this analyzation of the banks. Data of five years (from 2008-09 to 2012-13) has been used by researcher. Srivastava et al. (2015) found that all the bank groups showed increase in deposits, profitability, assets, interest and non-interest income, investments, and advances, during the period of five years from 2008-09 to 2012-13.
Mahesh et al. (2019) conducted a comparative study between private and public banks in India through the camel rating system. Axis Bank and Kotak Mahindra Bank from Private Sector and Bank of Baroda and State Bank of India from the public sector are taken for this study. Required Data of all respective banks have been collected for five years i.e. 2013-14 to 2017-18. To analysis the dada CAMEL rating system has been applied. The study concluded that Public and Private Banks are performing well in maintaining the Capital adequacy. Due to Non Performing Assets, Public Banks are facing major problems in Asset management. There is no major difference between public and private banks on the basis of liquidity parameters (Aggarwal & Mittal, 2012; Singh & Tandon, 2012).
Objectives of the Study
Objective of a study provides the directions to researcher. Objective should be specific exactly what you will do in each phase of your study. The current study is based on following objectives:-
1. To analyse the performance of Private sector banks.
2. To evaluate the capital adequacy of private sector banks
3. To analyse the assets management of selected private banks.
4. To evaluate the earning capacity and Liquidity of private banks.
5. To compare the performance of private sector banks, namely-HDFC, ICICI, Axis bank, and KOTAK Mahindra bank.
Research Empirical Results
This study is based on the analysis of private sector banks. Currently 22 banks are working under private sector banks in India. Out of 22 banks, following four banks are selected on the basis of market position, profitability and capitalization.
1. HDFC Bank (Housing Development Finance Corporation Limited)- 1994
2. ICICI Bank (Industrial Credit and Investment Corporation of India)- 1994
3. Kotak Mahindra Bank - 2003
4. AXIS Bank -1993
This present study is based on secondary data. For evaluating the performance of these selected banks required data is collected from annual reports of respective banks and RBI’s website. Time period of ten years from financial year 2010-11 to financial year 2019-20 is considered for the current study. After collecting required data, CAMEL model is applied for analyse of data collected from these banks. Under CAMEL model rating of bank is done along five key boundaries – Capital Adequacy, Asset Quality, Management Capability, Earning Capacity, and Liquidity.
Analysis and Interpretation
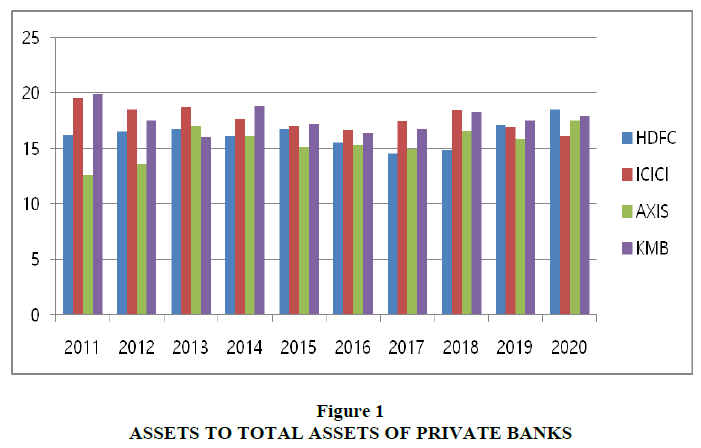
Table 1 is indicating about the capital adequacy of HDFC, ICICI, AXIS and Kotak Mahindra Bank. In this study capital adequacy of bank is measured by capital adequacy ratio and debt- equity ratio. Figure 1 is showing the capital adequacy ratio of all four banks. The capital adequacy ratio of ICICI Bank is comparatively higher than other three banks which is a positive point. This Ratio in the case of HDFC and AXIS bank is fluctuating till 2019 but increases in 2020. Capital adequacy ratio of the Kotak Mahindra Bank is fluctuating from 2011 to 2020. All four banks have enough capital available to them to deal with operational risks (Aspal, 2013; Saluja & Kaur, 2010).
| Table 1 Capital Adequacy of Private Banks | ||||||||
| Year | HDFC Bank | ICICI Bank | AXIS Bank | Kotak Mahindra Bank | ||||
| CA. Ratio | D.E. Ratio | C.A. Ratio | D.E. Ratio | C.A. Ratio | D.E. Ratio | C.A. Ratio | D.E. Ratio | |
| 2011 | 16.22 | 0.49 | 19.54 | 2.28 | 12.65 | 0.05 | 19.92 | 2.54 |
| 2012 | 16.52 | 0.74 | 18.52 | 2.32 | 13.66 | 0.18 | 17.52 | 2.08 |
| 2013 | 16.8 | 0.94 | 18.74 | 2.45 | 17 | 0.06 | 16.05 | 2.16 |
| 2014 | 16.07 | 1.03 | 17.7 | 2.34 | 16.07 | 0.12 | 18.83 | 1.05 |
| 2015 | 16.79 | 0.9 | 17.02 | 2.42 | 15.09 | 0.54 | 17.17 | 0.86 |
| 2016 | 15.53 | 0.89 | 16.64 | 2.26 | 15.29 | 0.06 | 16.34 | 1.3 |
| 2017 | 14.55 | 1.03 | 17.39 | 1.72 | 14.95 | 0.07 | 16.77 | 1.31 |
| 2018 | 14.82 | 1.46 | 18.42 | 1.97 | 16.57 | 0.08 | 18.22 | 1.16 |
| 2019 | 17.1 | 1.04 | 16.89 | 1.74 | 15.84 | 0.06 | 17.5 | 1.14 |
| 2020 | 18.52 | 0.74 | 16.11 | 1.66 | 17.53 | 0.13 | 17.89 | 0.99 |
| (a) C.A Ratio= Capital Adequacy Ratio(b) D.E. Ratio=Debt Equity Ratio | ||||||||
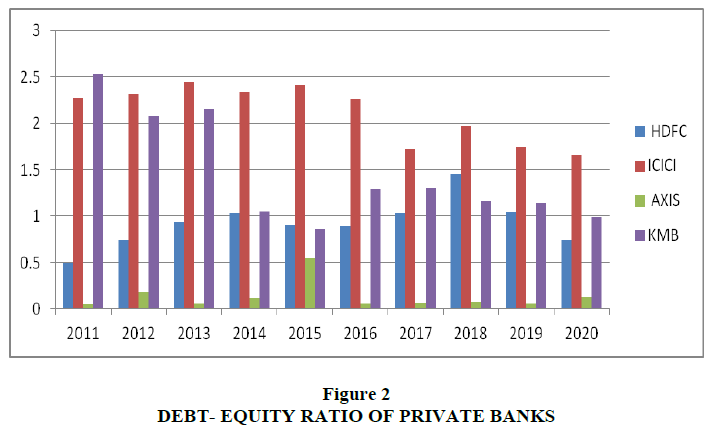
Figure 2 is representing the debt-equity ratio of all four banks. The debt-equity ratio tells us about the capital structure of an organization. ICICI bank is using more debt in its capital structure than other banks as the debt-equity ratio of ICICI is highest among 4 banks. Debt-equity ratio of Kotak Mahindra bank is decreasing that reflects the reducing debt of the bank. This ratio is fluctuating in the case of HDFC bank. AXIS bank is more depend on equity than debt as its debt-equity ratio is lowest in comparison to other banks.
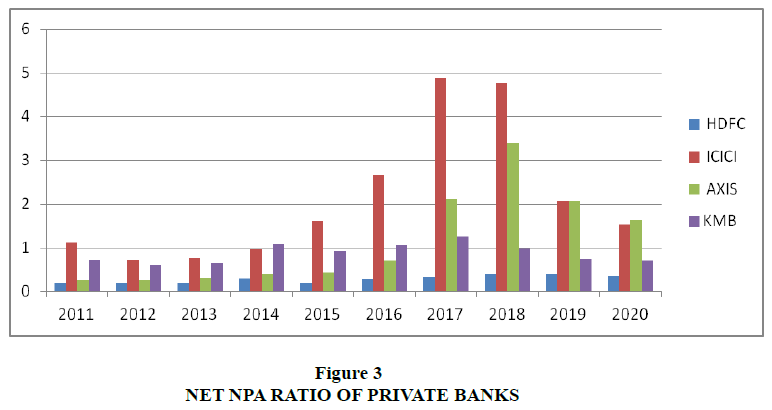
Table 2 is representing the data related to “Assets Quality” of four banks from 2011 to 2020. Figure 3 represents Net NPA Ratio of HDFC, ICICI, AXIS and Kotak Mahindra Bank. Higher Net NPA denotes poor asset quality whereas Lower Net NPA denotes better asset quality of the business. The Net NPA ratio of HDFC Bank shows fluctuations during the period which shows that the bank is sufficient enough to hold the credit risks of the business. The ratio of the ICICI bank and AXIS bank are increasing every year. These banks are facing troubles to maintain the assets quality. In the case of KOTAK Mahindra Bank, the ratio is fluctuating in a downward state which is good for the business.
| Table 2 Assets Quality of Private Banks | ||||||||
| Year | HDFC Bank | ICICI Bank | AXIS Bank | Kotak Mahindra Bank | ||||
| Net NPA | Gross NPA | Net NPA | Gross NPA | Net NPA | Gross NPA | Net NPA | Gross NPA | |
| 2011 | 0.2 | 1.05 | 1.11 | 4.47 | 0.26 | 1.01 | 0.72 | 2.03 |
| 2012 | 0.2 | 1.02 | 0.73 | 3.62 | 0.25 | 0.94 | 0.61 | 1.56 |
| 2013 | 0.2 | 0.97 | 0.77 | 3.22 | 0.32 | 1.06 | 0.64 | 1.55 |
| 2014 | 0.3 | 1 | 0.97 | 3.03 | 0.4 | 1.22 | 1.08 | 1.98 |
| 2015 | 0.2 | 0.9 | 1.61 | 3.78 | 0.44 | 1.34 | 0.92 | 1.85 |
| 2016 | 0.28 | 0.94 | 2.67 | 5.21 | 0.7 | 1.67 | 1.06 | 2.36 |
| 2017 | 0.33 | 1.05 | 4.89 | 7.89 | 2.11 | 5.04 | 1.26 | 2.59 |
| 2018 | 0.4 | 1.3 | 4.77 | 8.83 | 3.4 | 6.77 | 0.98 | 2.22 |
| 2019 | 0.39 | 1.36 | 2.06 | 6.7 | 2.06 | 5.26 | 0.75 | 2.14 |
| 2020 | 0.36 | 1.26 | 1.54 | 5.53 | 1.62 | 4.86 | 0.71 | 2.25 |
| (a) Net NPA = Net Non -Performing Assets Ratio (b) Gross NPA= Gross Non -Performing Assets Ratio |
||||||||
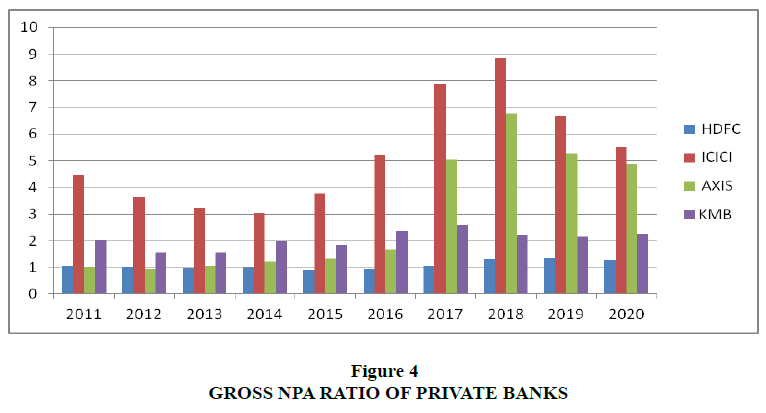
Figure 4 indicates the Gross NPA ratio of all four banks. The Gross NPA ratio of HDFC Bank is low till 2016 which is good for the business and then it rises back again after 2016 which is not good. In the case of ICICI Bank, the ratio is seen as somewhere declining which is favourable. The ratio of the AXIS bank is increasing during 2011 to 2020 which is negative for business of this bank. In the case of Kotak Mahindra bank, the ratio seems constant and higher from the other three which is indicating better asset quality for the business concern (Hui, 2012; Kaur & Saddy , 2011).
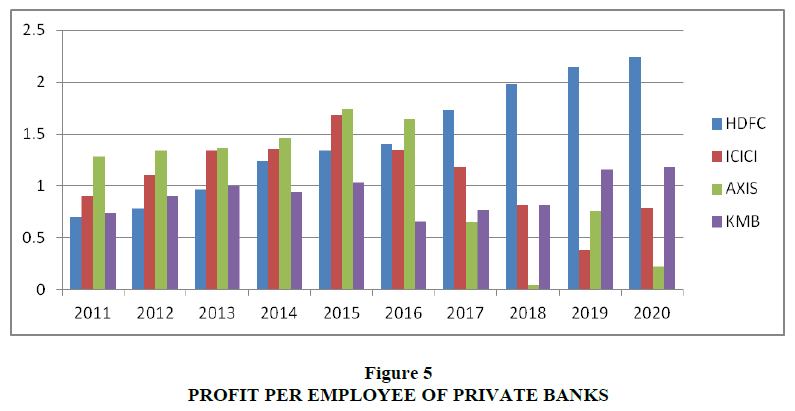
Management efficiency based on profit per employee and business per employee is shown by Table 3. Figure 5 represents the profit per employee of all four banks. The ratio of HDFC bank is indicating the good management efficiency of this bank as it is increasing from 2011 to 2020. The ratio of ICICI Bank is fluctuating first positively and then negatively. In the case of Kotak Mahindra Bank, the ratio shows negative fluctuations till the year 2018 and then rises in 2019 and 2020 which is positive for the business. In the case of AXIS bank, profit per employee rises till 2016 which is favourable for the bank, and then from 2017-2020 the ratio declines which is unfavourable for the business.
| Table 3 Management Efficiency of Private Banks | ||||||||
| Year | HDFC Bank | ICICI Bank | AXIS Bank | Kotak Mahindra Bank | ||||
| PPE | BPE | PPE | BPE | PPE | BPE | PPE | BPE | |
| 2011 | 0.7 | 6.61 | 0.9 | 7.76 | 1.28 | 12.55 | 0.74 | 5.33 |
| 2012 | 0.78 | 6.69 | 1.11 | 8.74 | 1.34 | 12.28 | 0.9 | 6.46 |
| 2013 | 0.97 | 7.76 | 1.34 | 9.39 | 1.37 | 11.86 | 1 | 7.37 |
| 2014 | 1.24 | 9.83 | 1.36 | 9.28 | 1.46 | 12.04 | 0.94 | 7 |
| 2015 | 1.34 | 10.7 | 1.68 | 11.3 | 1.74 | 14.29 | 1.03 | 7.83 |
| 2016 | 1.4 | 11.54 | 1.35 | 11.87 | 1.64 | 13.9 | 0.66 | 8.19 |
| 2017 | 1.73 | 14.2 | 1.18 | 11.52 | 0.65 | 13.91 | 0.77 | 6.67 |
| 2018 | 1.98 | 16.4 | 0.82 | 12.98 | 0.05 | 14.98 | 0.82 | 7.24 |
| 2019 | 2.14 | 17.76 | 0.38 | 14.29 | 0.76 | 16.84 | 1.16 | 10.33 |
| 2020 | 2.24 | 18.3 | 0.79 | 14.26 | 0.22 | 16.34 | 1.18 | 9.64 |
| (PPE in Millions & BPE in Crore) (a) PPE= Profit Per Employee (b) BPE= Business Per Employee |
||||||||
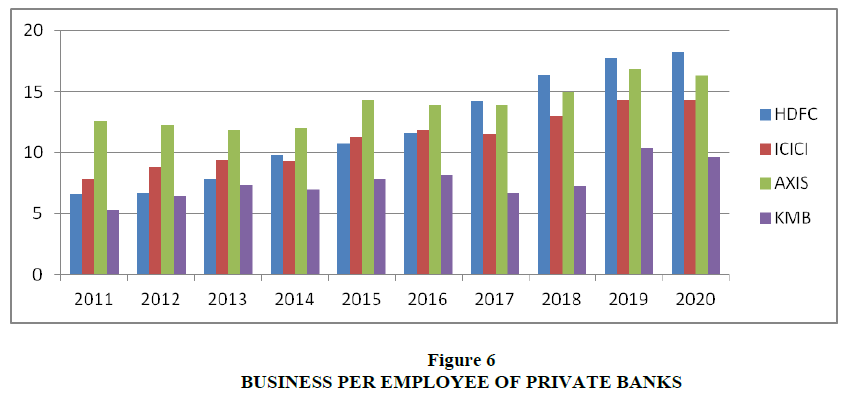
Figure 6 is representing the business per employee of all four banks. In the case of ICICI Bank and AXIS bank, the ratio is increasing with a constant rate; it is a sign of good position in the market. Business per employee is increasing constantly with a higher rate from 2011 to 2020 in the case of HDFC Bank which is showing good earning capacity of this bank. The business per employee of Kotak Mahindra Bank increases till the year 2019 and then decrease in the year 2020 which is unfavourable for the bank.
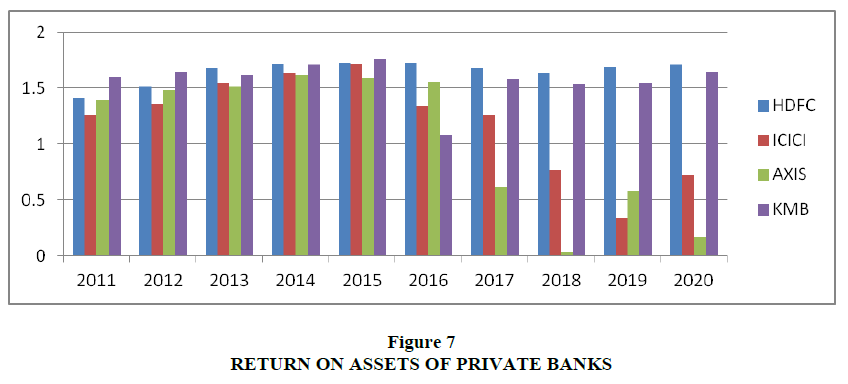
Table 4 gives a clear picture of earning capacity of four selected banks. Here earning capacity of banks is measured by Return on Assets and Interest Income to Total Assets. Higher the ratio means better business position and vice versa. Figure 7 indicates the Return on Assets Ratio of four banks from 2011 to 2020. This ratio of HDFC bank is constantly increasing which depicts a good position whereas, in the case of ICICI Bank, the ratio is increasing till 2015 and then declines from 2016, which is unfavourable for the ICICI Bank. The ratio of AXIS Bank is also increasing till 2015 then declining after 2015 with a higher rate which is not good for business. In the case of Kotak Mahindra Bank, the ratio is continuously increasing which is showing good profitability of bank except for the 2016 year.
| Table 4 Earning Capacity of Private Banks | ||||||||
| Year | HDFC Bank | ICICI Bank | AXIS Bank | Kotak Mahindra Bank | ||||
| ROA | IITA | ROA | IITA | ROA | IITA | ROA | IITA | |
| 2011 | 1.41 | 7.18 | 1.26 | 6.39 | 1.39 | 6.24 | 1.6 | 8.23 |
| 2012 | 1.52 | 8.07 | 1.36 | 7.08 | 1.48 | 7.7 | 1.65 | 9.41 |
| 2013 | 1.68 | 8.75 | 1.55 | 7.46 | 1.52 | 7.98 | 1.62 | 9.6 |
| 2014 | 1.72 | 8.36 | 1.64 | 7.42 | 1.62 | 7.99 | 1.71 | 10 |
| 2015 | 1.73 | 8.2 | 1.72 | 7.59 | 1.59 | 7.68 | 1.76 | 9.16 |
| 2016 | 1.73 | 8.49 | 1.34 | 7.31 | 1.56 | 7.8 | 1.08 | 8.52 |
| 2017 | 1.68 | 8.02 | 1.26 | 7.01 | 0.61 | 7.4 | 1.58 | 8.24 |
| 2018 | 1.64 | 7.54 | 0.77 | 6.25 | 0.03 | 6.62 | 1.54 | 7.45 |
| 2019 | 1.69 | 7.95 | 0.34 | 6.57 | 0.58 | 6.86 | 1.55 | 7.66 |
| 2020 | 1.71 | 7.5 | 0.72 | 6.8 | 0.17 | 6.84 | 1.65 | 7.47 |
| (a) ROA= Return on Assets Ratio (b) IITA= Interest Income to Total Assets Ratio | ||||||||
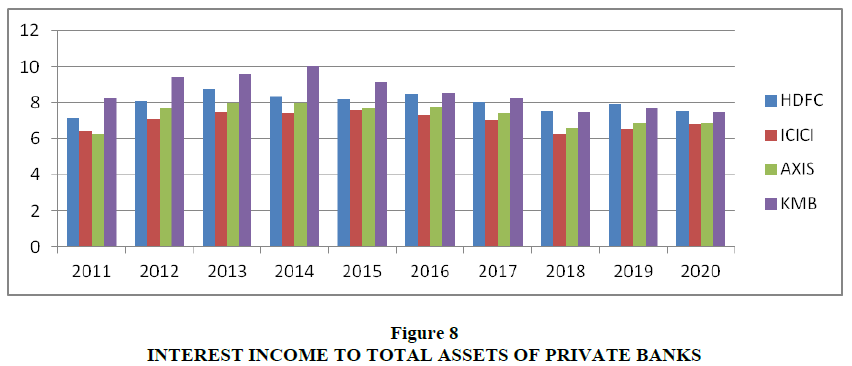
Figure 8 shows interest income to total asset ratio of four banks. The higher ratio indicates the better earning position of the bank and the lower ratio indicates the low lending capacity of banks. Interest Income to Total Assets ratio of HDFC bank is increasing till 2016 and then falling down from 2017 to 2020. The ratio in the case of KOTAK Mahindra bank increase positively till 2016 and then declines in later years. This ratio in cases of ICICI Bank and AXIS bank is similar as that of HDFC Bank (Kadam & Sapkal, 2019).
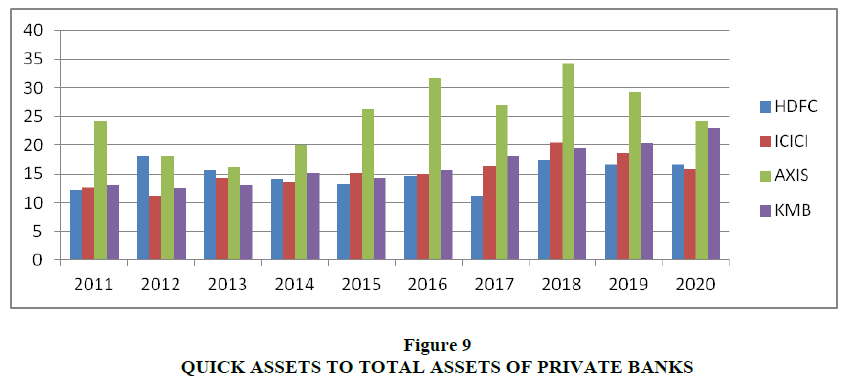
Table 5 is representing the liquidity position of all four banks based on quick assets to total assets ration and cash to deposit ratio. These ratios help in checking out banks’ capability to use their cash and liquid assets to wipe off the current liabilities if any. Figure 9 represents the quick assets to total assets ratios of four banks. This ratio in case of HDFC Bank is majorly fluctuating till 2018 and then falls down in the years 2019 and 2020. The ratio in the case of AXIS Bank is positively fluctuating but declines in 2017, 2019, and 2020. This ratio of ICICI Bank is fluctuating till 2018 and then declines in the last two years. The ratio in the case of KOTAK Mahindra bank is increasing during the last ten years.
| Table 5 Liquidity of Private Banks | ||||||||
| Year | HDFC Bank | ICICI Bank | AXIS Bank | Kotak Mahindra Bank | ||||
| QATA | CD | QATA | CD | QATA | CD | QATA | CD | |
| 2011 | 12.12 | 12.03 | 12.56 | 9.27 | 24.22 | 7.34 | 13.12 | 7.2 |
| 2012 | 18 | 6.08 | 11.25 | 8.01 | 18 | 4.86 | 12.45 | 5.23 |
| 2013 | 15.65 | 4.94 | 14.2 | 6.51 | 16.12 | 5.86 | 13.15 | 4.33 |
| 2014 | 14 | 6.9 | 13.56 | 6.57 | 20 | 6.07 | 15.24 | 4.99 |
| 2015 | 13.21 | 6.1 | 15.25 | 7.1 | 26.19 | 6.15 | 14.23 | 5.25 |
| 2016 | 14.51 | 5.5 | 14.97 | 6.43 | 31.77 | 6.25 | 15.61 | 4.98 |
| 2017 | 11.19 | 5.89 | 16.31 | 6.47 | 27.1 | 7.45 | 18.09 | 4.76 |
| 2018 | 17.48 | 13.27 | 20.44 | 5.9 | 34.19 | 7.82 | 19.49 | 4.62 |
| 2019 | 16.61 | 5.07 | 18.66 | 5.8 | 29.28 | 6.4 | 20.24 | 4.82 |
| 2020 | 16.62 | 6.29 | 15.76 | 4.58 | 24.17 | 13.27 | 23.01 | 3.62 |
| (a) QATA= Quick Assets to Total Assets Ratio (b) CD= Cash to Deposit Ratio | ||||||||
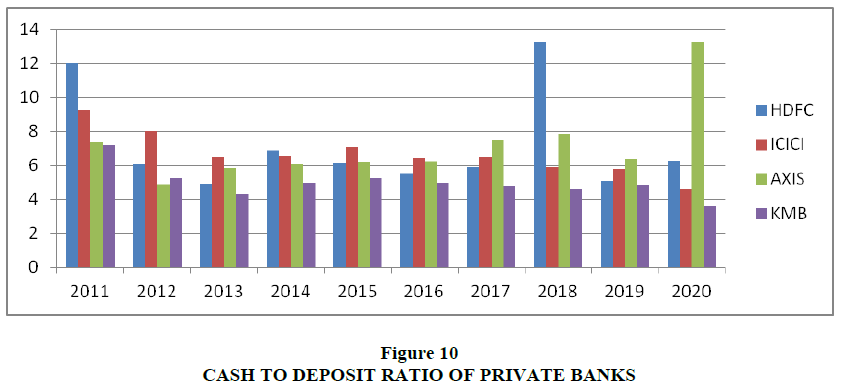
Figure 10 represents the cash - deposit ratio of all four banks. In the case of ICICI Bank, the ratio is decreasing, which is unfavourable for the liquidity position of the bank. If we talk about the HDFC Bank, the ratio is seen as highest in 2011 and 2018 and then the performance decrease. The ratios in the case of AXIS Bank fluctuate positively and seen as the maximum in 2020. Lastly, in the case of Kotak Mahindra Bank, the ratio is constantly declining which is negative from the bank’s perspective. It is advisable for the banks to maintain liquidity to operate in business and the cash to deposit ratio depicts such liquidity position of the banks.
Suggestions and Findings
From the above analysis the following outcomes are found about the financial performance of these 4 five banks named HDFC bank, ICICI bank, Axis Bank and Kotak Mahindra Bank on the basis of CAMEL tool.
1. C- ICICI Bank and Kotak Mahindra Bank maintained good capital adequacy ratio. ICICI Bank has highest debt equity ratio from other banks. ICICI Bank is trying to take advantage of financial leverage and is also exposed to greater financial risk. Axis Bank is depending more on equity than debt. The debt-equity combination is better in the case of HDFC and Kotak Mahindra Banks. All four banks have sufficient capital to bear risk.
2. A-In case of assets quality, the Kotak Mahindra Bank and the HDFC Bank are performing well on the basis of Net NPA and Gross NPA Ratio in comparison to other banks. These banks are sufficient enough to hold the credit risks of the business whereas the ICICI Bank and AXIS Bank are facing troubles to maintain the assets quality as their Net NPA and Gross NPA ratios are increasing.
3. M-When we are talking about the management efficiency of private banks, the position hold by HDFC is first whereas Kotak Mahindra bank stands at second position. HDFC Bank and Kotak Mahindra Bank are managing their business activities efficiently. But ICICI and AXIS Banks are not showing great management efficiency during the last 10 years.
4. E-On the basis of earning capacity of private banks, HDFC Bank and Kotak Mahindra Bank are showing increasing trend in profitability. But in case of ICICI and AXIS Banks, return on assets and interest income to total assets are declining after 2015. These two banks need to improve their earning capacity.
5. L-In the case of Liquidity of the bank, it can be concluded that AXIS Bank performs better this time to maintain the highest liquidity position amongst the other 3 banks. AXIS Bank has sufficient cash and liquid assets to wipe off the current liabilities. HDFC, ICICI and Kotak Mahindra Bank need to improve their cash and quick assets.
The overall performance of HDFC Bank and Kotak Mahindra Bank is better as per capital adequacy, assets quality, management efficiency, earnings, and liquidity. But the performance of ICICI and AXIS bank is declining especially from the last five years. ICICI and AXIS Banks should improve their earnings performance, assets quality, and management efficiency to remain in top list of private banks. Otherwise, it will be difficult for these banks to face the competition between private banks in India. During 2019-2020, Covid pandemic creates a threat for almost all industries. The banking industry also affected by the covid pandemic.
On the one hand, Covid Pandemic Create threat, on the other hand it is providing great opportunities to banks to overcome their downfalls with the adoption of new policies regularly framed by RBI. We suggest that all four banks should look forward towards upcoming changes in the economic system and policies more closely to reduce future uncertainty and risk. This will increase the possibilities for these banks to remain in the top list of private banks. Due to major changes in economy as an effect of Covid Pandemic, All four banks have to look forward to the new ways of banking as compared to the previous years.
References
- Aggarwal, S., & Mittal, P. (2012). Non-performing assets: Comparative position of public and private sector banks in India. International Journal of Business and Management Tomorrow, 2(1), 1-7.
- Aspal, P.K. (2013). A Camel Model Analysis of State Bank Group. World journal of Social Sciences, 1(3), 4
- Debnath, R.M., & Shankar, R. (2008). Measuring performance of Indian banks: an application data envelopment analysis. International Journal of Business Performance Management, 10(1), 57-85.
- Gupta, R. (2014). An analysis of Indian public sector banks using CAMEL approach. IOSR Journal of Business and Management, 16(1), 94-102.
- Hui, X. (2012). A comparison of financial performance of commercial banks: A case study of Nepal. African Journal of Business Management, 6(25).
- Kadam, M.M., & Sapkal, D. (2019). A Comparative Analysis of Performance of Public & Private Sector Banks in India Through Camel Rating System. International Educational Applied Research Journal (IEARJ), 3(1), 1-6,
- Kaur, H., & Saddy N.K. (2011). A comparative Study of Non-Performing Assets of Public and Private Sector Banks. International Journal of Research in Commerce and Management, 82-89.
- Saluja, J., & Kaur, R. (2010). Profitability performance of public Sector Bank in India. Indian Journal of Finance, 4(4), 17-25.
- Shah, V. (2015). An Analysis on the performance of private and public sector banks in India. International Journal ofr Technology Research in Engineering, 3(4).
- Singh, A.B., & Tandon, P. (2012). A study of financial performance: A comparative analysis of SBI and ICICI Bank. International Journal of Marketing, Financial Services & Management Research, 1(11), 56-71.
