Research Article: 2024 Vol: 30 Issue: 5
A Scientometric Analysis of the Social Network Theory on Small and Medium-Sized Enterprises (SMEs)
Normilia Abd Wahid, Universiti Teknologi MARA Pahang (Jengka Campus), Malaysia
Ilyani Azer, Universiti Teknologi MARA Pahang (Jengka Campus), Malaysia
Nurul Nadia Abd Aziz, Universiti Teknologi MARA Pahang (Raub Campus), Malaysia
Azeni Abu Bakar, Universiti Teknologi MARA Pahang (Raub Campus), Malaysia
Jolin Norshyme Hashim, Universiti Teknologi MARA Pahang (Raub Campus), Malaysia
Citation Information: Wahid. N. A, Aziz, N. N. A, Hussin .A., Bakar, A. A., Hashim, J N., Ilyani Azer., (2024). A Scientometric Analysis of the Social Network Theory on Small and Medium-Sized Enterprises (SMEs). Academy of Entrepreneurship Journal, 30(5),1-15.
Abstract
Social network theory has been propounded as an important resource base for entrepreneurship and serves as an underlying force for the development of entrepreneur behaviour. However, there is a lack of scientific research that uses CiteSpace to explore the relationship between the social network theory and small and medium-sized enterprises (SMEs). The purpose of this study was to gather literature-based information to assess the current status and development trends in social network theory and SME research. A scientometric analysis was undertaken by focusing on published literature, authors, affiliations, and collaborative networks among countries. Additionally, a co-citation dataset was examined, encompassing authorship, articles, and keywords. The results found a total of 441 related studies from 1994 to 2022. Notably, Shu C. L. and Zhao L. emerged as the most influential authors while the Journal of International Business Studies was the most influential journal. Key clusters associated with network start-up, social network analysis, and future research opportunities were also identified as prevalent keywords. The findings illustrated a pattern towards inclusivity and ongoing advancement of interdisciplinary fusion within the realm of the social network theory, especially in SME development.
Keywords
social network theory, small and medium-sized enterprises (SMEs), scientometric analysis
Introduction
Small and medium-sized enterprises (SMEs) have long been acknowledged for their significant contribution towards a country’s economic development, innovation, and job creation (Savlovschi & Robu, 2011). According to the World Bank (2022), SMEs represent approximately 90% of registered businesses and 50% of employment worldwide, while contributing more than 35% of the Gross Domestic Product in emerging economies. Due to their relatively small size, SMEs are often characterised by liability of smallness (Lechner & Dowling, 2003; Ulvenblad & Barth, 2021; Lefebvre, 2022). Past studies have highlighted many liabilities faced by SMEs over large companies, such as resource constraints, lack of skilled personnel (Saleh & Nelson, 2006), difficulty in making high-interest payments (Ulvenblad & Barth, 2021), lower operating performance, and higher failure rate or bankruptcy (Lefebvre, 2022). Despite the rapid development in digital transition, existing evidence shows that SMEs are falling behind in adopting digital technologies and other infrastructures (OECD, 2017). The emergence of digital technologies and the interconnectedness of today’s business landscape have also intensified the challenges faced by SMEs.
Many scholars believe that social networks can provide entrepreneurs with valuable resources (e.g., tangible and intangible knowledge), allowing them to overcome difficulties and challenges while ensuring their survival (Peng & Liu, 2022) and economic growth. The social network theory (Dunn, 1983) is considered an important framework to examine the interpersonal mechanism and social structure that exist among individuals, groups, or organisations (Sharafizad & Brown, 2020). In the context of SMEs, the social network theory helps to explain the relationship between entrepreneurs and their environment. At the initial stage of a start-up, entrepreneurs usually depend much on their own resources; as the business grows, they may increase their resources through their network of relationships.
Scientometric analysis refers to the use of quantitative methods to analyse scientific literature, enabling researchers to identify and capture the key contributors, significant publications, research trends, emerging themes, and knowledge patterns within a specific domain. Such method has been widely utilised in many fields, including medical health, environment, social science, as well as business and management (Noor, Awang, & Abdullah, 2023; Xu, Liu, & Cai, 2023). Various scientific mapping software is currently available, such as CiteSpace and VOSviewer. CiteSpace is among the software widely utilised for visualising and analysing the literature of a scientific or knowledge domain (Chen 2020). It is commonly used for scientometric data analysis and supports major bibliographic data sources like the Web of Science (WoS), Scopus, and Dimensions.
While past studies have explored the application of the social network theory across various fields like sociology and organisational studies, limited evidence exists concerning its application to SMEs, especially in the form of scientometric study. Therefore, the purpose of this study is to conduct a scientometric analysis of the social network theory on SMEs, aiming to provide insights and an in-depth understanding about the current state of research, identify research gaps, and highlight future directions in this field. The specific objectives are (i) to determine the research landscape of the social network theory on SMEs in terms of year, journals, co-cited journals, authors, countries, institutions, keywords, and references; and (ii) to explore the key topics and developments. The findings hope to contribute towards the identification of rapidly growing subject areas related to social network theory research and deepen the current understanding on the network patterns and tracking research hotspots, especially for novice researchers. Employing the scientometric techniques will also provide insights into the growth and impact of the social network theory on SME research.
Methods
The review study applied the scientometric method to analyse journal articles published between 1994 to 2022 in the business domain concerning the social network theory and SME.
Database Searches
Clarivate Analytics was employed to gather document information from the WoS core collection database. Such database has been heavily utilised in review articles like scientometric due to its reputation and size, encompassing scientific articles of top nations, journals, scientists, and institutions across various fields of study.
The WoS search was conducted using keywords (search code) that are frequently used concerning the social network theory and SME. The Boolean operators “OR” and “AND” were utilised to include at least one of the given phrases used to define the social network theory and SME. Some search codes had a special “*” character at the end to denote variations, which widened the search. When the field “TS” is ticked, WoS searches the manuscript’s title, abstract, keywords, authors, and Keywords Plus as the search option (Adriaanse & Rensleigh, 2013).
The search code used was TS=(((“SOCIAL NETWORK THEORY”)) AND ((“SMALL MEDIUM ENTERPRISE”) OR (“SME”) OR (“SMES”) OR (“ENTREPRENEURSHIP”) OR (“ENTREPRENEUR”) OR (“ENTREPRENEURS”) OR (“SMALL BUSINESS”) OR (“BUSINESS”) OR (“BUSINESSES”) OR (“START-UP”) OR (“ENTERPRISE”) OR (“ENTERPRISES”) OR (“VENTURE CAPITAL”) OR (“BUSINESS VENTURE”) OR (ORGANIZATION) OR (ORGANIZATION) OR (ENTREPRENEURIAL) OR (“ENTREPRENEURIAL ENTERPRISES”) OR (“SELF-EMPLOYMENT”) OR (“SMALL ENTERPRISE”) OR (“MEDIUM FIRM”) OR (“MEDIUM BUSINESS”) OR (MEDIUM ENTERPRISE”) OR (SMALL AND MEDIUM-SIZED ENTERPRISE”) OR (“SMALL AND MEDIUM-SIZED BUSINESS”))).
This study focuses on social network theory and SME research published in the last three decades. Hence, the search was limited to articles published between 1994 and 2022. The publication types only included original research articles while editorials, reviews, comments, brief statements of findings, books and book chapters, protocol papers, and theory/discussion papers were excluded. These research articles were conducted using mixed-methods, qualitative, and quantitative research designs.
Table 1 shows the article retrieval process of this study. The database search was conducted on 6 July 2023 and yielded 441 publications, which were filtered by the field “research areas = social network theory”. The database was then filtered by “articles” and “English”, resulting in a total of 346 articles that were used for further analysis. These included 10467 sums of times cited (articles without self-citations = 10363).
| Table 1 Datasets Retrieval Process | ||
| Date: 6 July 2023 | Database: ISI WOS | Search string: social network theory and small medium enterprise or sme or smes or entrepreneurship or entrepreneur or entrepreneurs or small business or business or businesses or start-up or enterprise or enterprises or venture capital or business venture or organization or organization or entrepreneurial or entrepreneurial enterprises or self-employment or small enterprise or medium firm or medium business or medium enterprise or small and medium-sized enterprise or small and medium-sized business. |
| Total documents identified and screened | 441 articles | |
| Filter First Stage | Document Type: Article | |
| Document filters applied | 365 articles | |
| Filter Second Stage | Language: English | |
| Document filters applied | 354 articles | |
| Filter Third Stage | Year: Exclude 2023 | |
| Document filters applied | 346 articles | |
Data Analysis
Microsoft Excel 2016 and CiteSpace V version 5.2.R 2.3.26.2018 for 64-bit Windows were used for descriptive and scientometric analyses, respectively. The following sub-section explains the use of both tools in detail.
Descriptive Analysis
A descriptive analysis was performed to identify the number of articles published annually, the publishing journals, the most productive authors, universities, or institutions, and the nations where the authors were based when the articles were published. Microsoft Excel 365 was used to count the annual volumes of publications for the social network theory and SME research Table 2.
| Table 2 Overview of the Techniques and Tools Used to Answer the Research Questions | |||
| ID | Research Question Focus | Software | Summary of Techniques/Tools |
| RQ1 | Publication output trends | Excel | Descriptive analysis of the number of publications, published journals, authors, universities/institutes, and country/region. |
| RQ2 | Dominant knowledge carriers | CiteSpace | Co-citation analysis (author, journal, country, institutions, research areas, and articles) to determine the development status and scientific structure for each variable. |
| RQ3 | Dominant topic/cluster | CiteSpace | Document cluster analysis to identify the tip cluster of research in focus areas. |
| RQ4 | Impactful publications and keyword | CiteSpace | Burstness metric to determine the influential publications and top keywords. |
Scientometric Analysis
In this study, knowledge graph analysis and visualisation were done using CiteSpace. The software was created by Chen (2016) and offers the most complete toolkit for creating numerous bibliometric networks using a variety of analytical techniques. Additionally, this study used a dual-map overlay to analyse the inter-domain and specialty trends connecting the social network theory and SME research. The literature was divided into two categories: (i) cited journals and (ii) citing journals, with the latter referencing the former. The degree of strength of these connections was assessed and illustrated visually. Subsequently, the following analyses were performed using CiteSpace to determine the co-citing authors, publications, journals, as well as clusters and keywords: (i) Author Co-citation Analysis (ACA), which considers two authors to be co-cited if they are cited together in a paper; (ii) Journal Co-citation Analysis (JCA), which identifies journals that are cited together in a paper; (iii) Document Co-citation Analysis (DCA), which determines a co-citation when two sources are cited together in a paper; and (iv) Cluster Analysis, which explores the naturally occurring groups within a data set known as clusters.
The input data for CiteSpace was retrieved from the WoS database. Top N and Top N% were used as the threshold settings that enabled article selection and construction of an individual network. Depending on the specified input value and node type, the Top N per slice process employed in this study selected the most cited items from each slice to create a network. The top 50 most cited articles were later identified and ranked as the value of 50 and multiple node kinds were chosen for this study. Based on the chosen value, the Top N% per slice procedure revealed the proportion of the most mentioned articles. A multidimensional clustering algorithm was later applied for cluster identification purposes.
Quality Control and Impact
Modularity q-index, average silhouette metric, and betweenness centrality were employed to assess the characteristics and homogeneity of the analysis and identified clusters. The modularity q-index ranges from 0 to 1, with more reliability is indicated by larger indices. Values over 0 suggest stronger homogeneity, with the average silhouette measure ranging between -1 and 1 (Chen, 2016). Meanwhile, betweenness is a measurement of influence that indicates how different publications or journals are far apart from one another. Publications with higher betweenness are deemed to have a greater influence on the network because more information and paths will move through them.
Furthermore, the citation burstness and sigma of significant articles and journals were calculated. According to Chen (2016), sigma and citation burstness are temporal measures whereby a red ring will appear around the node to denote burst detection, which is a quick spike in citations for a particular article. Meanwhile, a burst is described as an abrupt elevation of the frequencies [of citations] over a specific time interval. The result of combining betweenness centrality and burstness is known as sigma. Such metric varies from 0 to 1 and is often used to detect and measure innovative ideas reported in scientific papers. In this study, burstness was computed as centrality + 1, with greater value was associated with high-value research Figure 1.
Results
Descriptive Statistics
Publications Trend
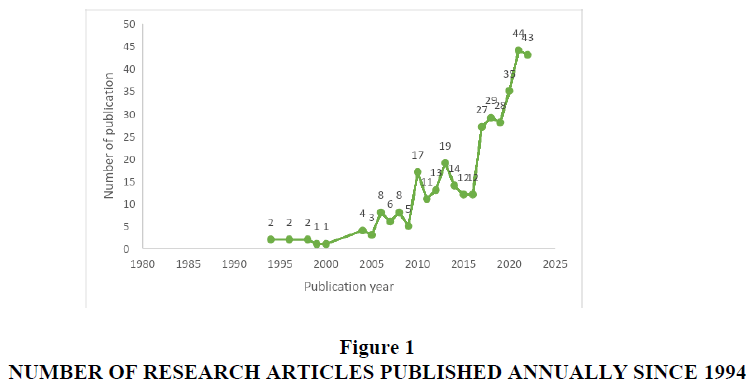
Figure 2 shows the number of social network theory documents that were published between 1994 and 2022. These statistics were retrieved from the WOSCC database. A total of 346 publications was found and the number increased over the years. In 1994, there were only two articles published on this topic and less than 10 publications existed until 2009. However, the number of publications increased to 17 articles in 2010 and it gradually rose ever since. This is evidenced by the average number of publications per year, which increased from 3.8 between 1994 to 2009 to 23.4 between 2010 to 2022, denoting an average of 14.42 articles published annually. In 2021, the number of published articles was at its highest with 44 articles.
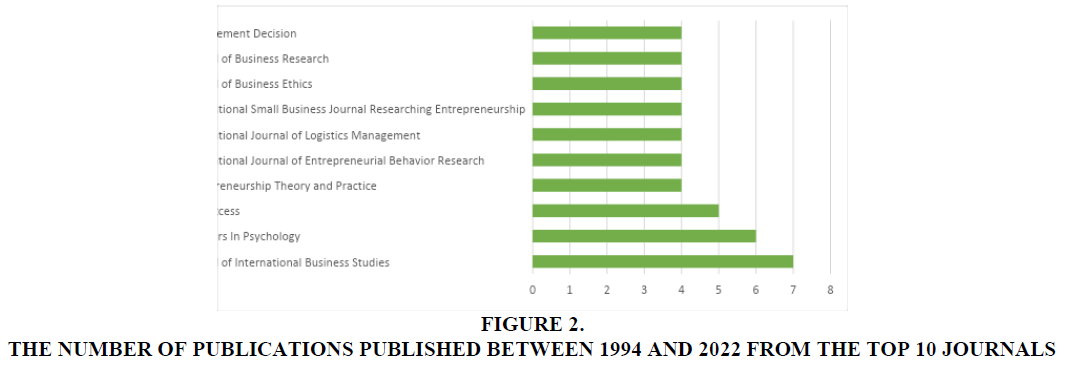
Figure 3 shows the top 10 journals by the number of publications. The eligible articles in this study were identified from 253 journals, of which the Journal of International Business Studies was ranked first with 7 articles. This is followed by Frontiers in Psychology and Sustainability (6 articles) and IEEE Access (5 articles).
Productive Authors
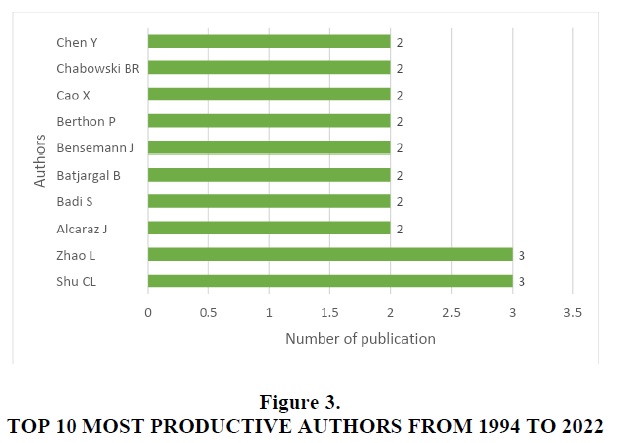
The top 10 authors who published articles related to the social network theory. It can be seen that only 49 (5.1%) out of the 960 authors produced more than one article. Authors with the most publications were Shu C. L. and Zhao L. who produced 3 articles each.
Top Institutions
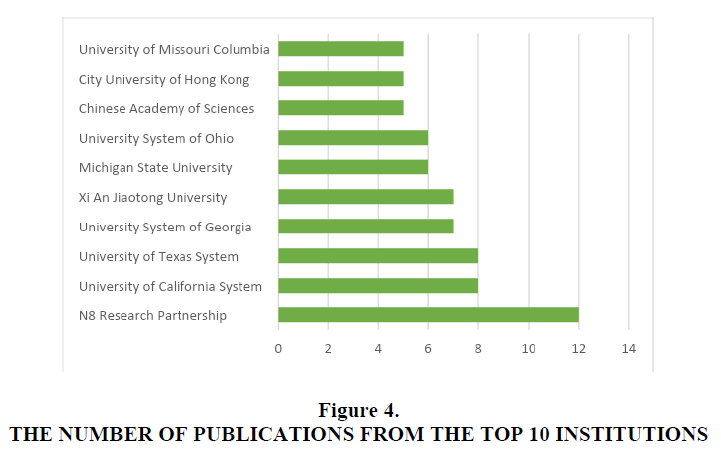
Figure 4 shows the top 10 institutions with the most number of publications. N8 Research Partnership is ranked first with 12 articles, followed by the University of California System and the University of Texas System with 8 articles, respectively. Whereas, the University System of Georgia and Xi An Jiaotong University were ranked third, each having 7 articles.
Regional Distribution
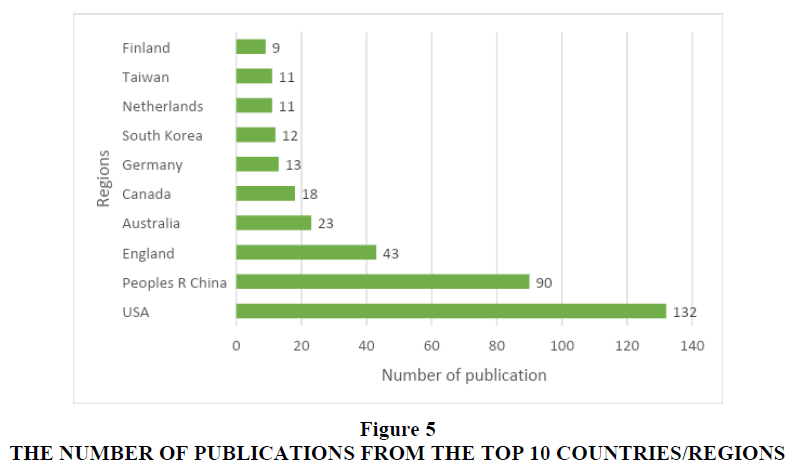
Figure 5 shows the number of publications from the top 10 countries, accounting for 72.6% of all social network theory research published across 57 countries globally. The United States of America (USA) has the highest number of publications (132 articles), followed by the People’s Republic of China (90 articles) and England (43 articles).
Dual-map Overlay
Factors that Influence Development of a Strong, Long-Lasting Legacy from Events
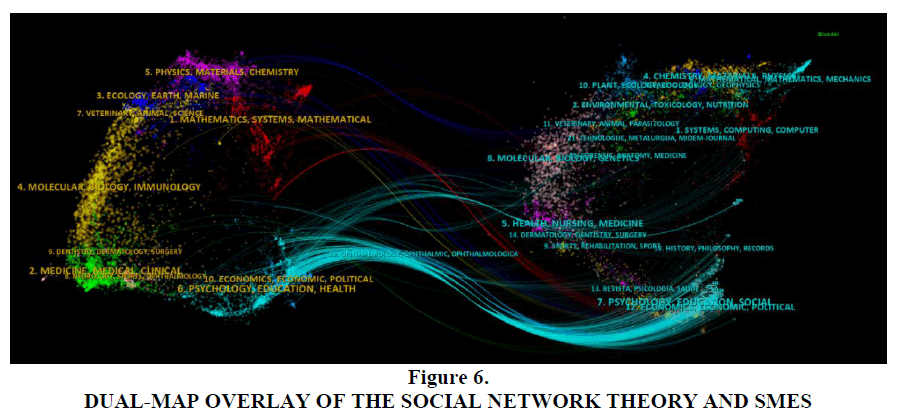
The dual-map overlay design has been recently introduced to effectively present comprehensive citations within research domains. These maps were sourced from a collection of bibliographic records generated from WoS and stored in a file derived from CiteSpace runs. Each overlay in the maps was distinguished by various colours, representing unique citation arcs associated with distinct fields. Illustrates the current dual-map overlay, which was specifically tailored to the research domains explored in this study. The results denoted that studies on the social network theory focus on economics, politics, psychology, education, and politics (Figure 6) while the cited articles concern psychology, education, economics, politics, and health.
Co-Citation Analysis
Author Co-citation Analysis
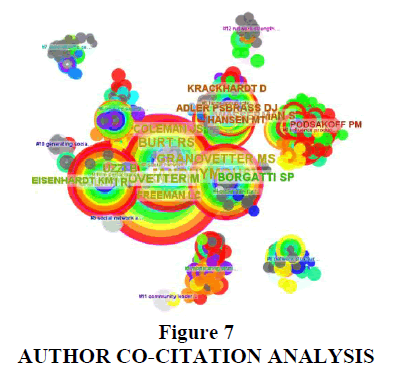
Figure 7 shows the list of authors with centrality scores greater than 0.1, where the font size increases as the centrality score increases. Powell W. W. was the most interconnected author, with a centrality score of 0.05, a degree of 42, and a sigma of 1.33. This is followed by Kogut B. (Sigma: 1.28; Centrality: 0.07; Degree: 53) and Frédéric Gazeau (Sigma: 1.23; Centrality: 0.06; Degree: 46;). Details of the top 10 most influential authors are shown in Table 3.
| Table 3. The Top 10 Most Influential Authors in Social Network Theory and SME Research Based on Sigma Score, with the Highest at the Top | |||
| Label | Degree | Centrality | Sigma |
| Powell W. W. | 42 | 0.05 | 1.33 |
| Kogut B. | 53 | 0.07 | 1.28 |
| Barney J. | 46 | 0.06 | 1.23 |
| Cross R. | 23 | 0.02 | 1.1 |
| Reagans R. | 19 | 0.02 | 1.09 |
| Hair J. F. | 6 | 0 | 1.02 |
| Gu F. F. | 13 | 0 | 1.01 |
| Zhou K. Z. | 5 | 0 | 1.01 |
| Granovetter M. S. | 122 | 0.17 | 1 |
| Gulati R. | 100 | 0.14 | 1 |
Journal Co-citation Analysis
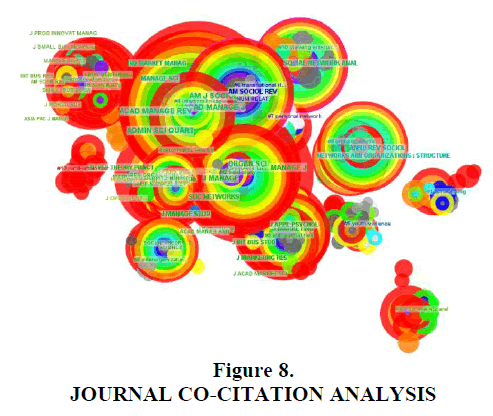
Table 4 lists the top 10 most influential journals in terms of degree, centrality, and Sigma scores. Human Relations recorded the highest degree score and emerged as the most influential journal (Degree: 89; Centrality: 0.14; Sigma: 1.57). Meanwhile, Social Network Analysis (Degree: 47, Centrality: 0.1, Sigma, 1.54) and Journal Annual Review of Sociology (Degree: 81; Centrality: 0.1; Sigma: 1.39) were the second and third most influential journals in the field of Social Network Theory research, respectively Figure 8.
| Table 4. Top 10 Journals in Social Network Theory and SME Research Based On Sigma Value | |||
| Label | Degree | Centrality | Sigma |
| Human Relations | 89 | 0.14 | 1.57 |
| Social Network Analysis | 47 | 0.1 | 1.54 |
| Annual Review of Sociology | 81 | 0.1 | 1.39 |
| California Management Review | 63 | 0.08 | 1.33 |
| Diffusion of Innovations | 47 | 0.05 | 1.28 |
| Research in Organizational Behavior | 52 | 0.06 | 1.24 |
| Networks and Organizations: Structure, Form, and Action | 54 | 0.05 | 1.23 |
| Organization Studies | 56 | 0.04 | 1.14 |
| Organizational Behavior and Human Decision Processes | 27 | 0.03 | 1.12 |
| Journal of International Management | 17 | 0.01 | 1.06 |
Document Co-citation Analysis
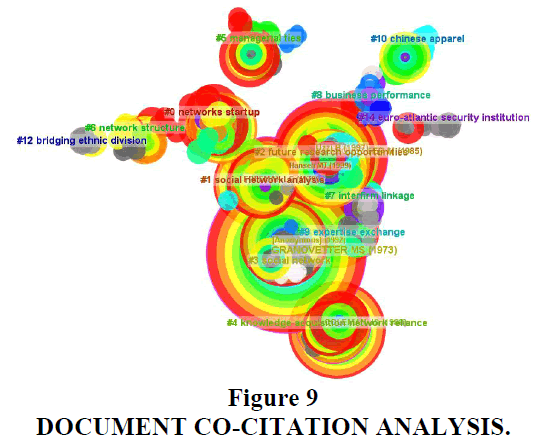
Table 5 shows the top 10 most influential scientific publications based on the sigma score. Burt R. S. (2004) had the most influential article titled “Structural Holes and Good Ideas” with a sigma score of 1.11. The article “Firm Resources and Sustained Competitive Advantage” by Barney J. (1991) had the second highest sigma value and was published in the Journal of Management. Finally, the third most influential article was “Evaluating Structural Equation Models with Unobservable Variables and Measurement Error” published by Fornell C. (1981) in the Journal of Marketing Research, which had a sigma score of 1.09 Figure 9.
| Table 5 The Top 10 Articles in Social Network Theory and SMES Based on Sigma Value | ||||
| Label | Degree | Centrality | Sigma | DOI |
| Burt R. S. (2004) | 20 | 0.02 | 1.11 | 10.1086/421787 |
| Barney J. (1991) | 27 | 0.03 | 1.09 | 10.1177/014920639101700108 |
| Fornell C. (1981) | 19 | 0.02 | 1.09 | 10.2307/3151312 |
| Sheng S. B. (2011) | 15 | 0.02 | 1.09 | 10.1509/jmkg.75.1.1 |
| Podsakoff P. M. (2003) | 24 | 0.02 | 1.08 | 10.1037/0021-9010.88.5.879 |
| Uzzi B. (1996) | 18 | 0.01 | 1.05 | 10.2307/2096399 |
| Borgatti S. P. (2011) | 7 | 0.01 | 1.05 | 10.1287/orsc.1100.0641 |
| Levin D. Z. (2004) | 11 | 0.01 | 1.03 | 10.1287/mnsc.1030.0136 |
| Gu F. F. (2008) | 11 | 0.01 | 1.02 | 10.1509/jmkg.72.4.12 |
| Borgatti S. P. (2009) | 13 | 0 | 1.01 | 10.1126/science.1165821 |
Document Cluster Analysis
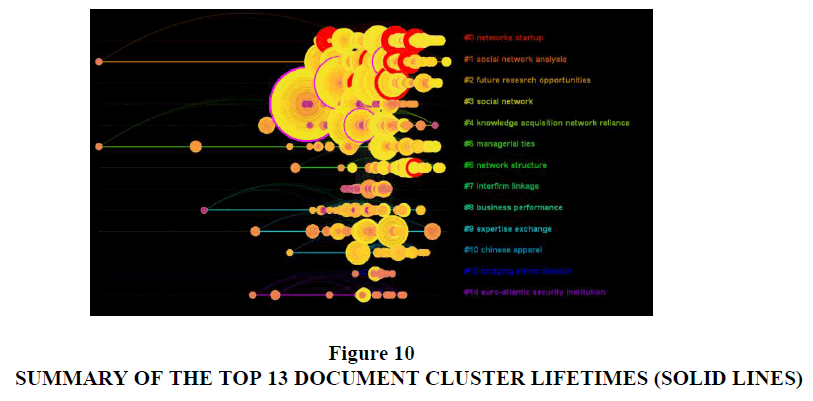
The document cluster analysis produced noteworthy findings on the Modularity Q Index and Mean Silhouette metrics with values of 0.7215 and 0.8403, respectively. These metrics exceeded the average thresholds, indicating a high level of reliability and consistency within the network under investigation. Such analysis successfully identified and delineated 13 distinct clusters with related documents. Represents these clusters as a horizontal line accompanied by cluster labels on the right side. The clusters are assigned with numbers and arranged in descending order according to their sizes, with the largest cluster is denoted as #0. The temporal existence of each cluster is represented by a solid yellow line confined within its boundaries. Subsequently, labels were assigned to the clusters by employing a text mining and keyword analysis algorithm within the CiteSpace software whereby the labels were determined via log-likelihood ratio (LLR) Figure 10.
Table 6 presents a comprehensive overview of 13 prominent clusters that were identified through the document cluster analysis, which effectively capture distinct research topics within the field. The degree of each cluster is determined by the number of publications. Notably, the top three clusters are particularly significant as they encompass more than 90 publications. Cluster #0 emerged as the largest and comprised a total of 100 publications.
| Table 6. Top 10 Group Clusters Based on the “Social Network Theory and SMES” Keyword | ||||
| ClusterID | Size | Silhouette | Label (LLR) | Average Year |
| 0 | 100 | 0.717 | networks startup | 2003 |
| 1 | 96 | 0.769 | social network analysis | 1999 |
| 2 | 91 | 0.734 | future research opportunities | 1998 |
| 3 | 73 | 0.958 | social network | 1992 |
| 4 | 65 | 0.9 | knowledge acquisition network reliance | 1993 |
| 5 | 45 | 0.884 | managerial ties | 1998 |
| 6 | 43 | 0.778 | network structure | 2007 |
| 7 | 36 | 0.965 | interfirm linkage | 1994 |
| 8 | 33 | 0.95 | business performance | 1990 |
| 9 | 32 | 0.869 | expertise exchange | 1994 |
| 10 | 29 | 0.948 | chinese apparel | 2002 |
| 12 | 18 | 1 | bridging ethnic division | 1998 |
| 14 | 15 | 0.974 | euro-atlantic security institution | 1991 |
Silhouette scores were calculated to evaluate the internal coherence of the clusters, yielding values ranging from 0.717 to 0.974. These scores served as indicators of the extent to which publications within each cluster share similarities. Silhouette scoring employs a scale of -1 to 1 with scores above 0 signify a high level of homogeneity within the cluster. Consequently, the obtained silhouette scores affirm a notable level of similarity among the publications within their respective clusters.
Cluster #0 represented the largest cluster and comprised 100 publications, with a silhouette value of 0.717. It was denoted by distinct labels, such as "networks startup," "firm performance," and "cognitive bias." The cluster's focal article was "The Relationship Between Network Capabilities and Innovation Performance: Evidence from the Chinese High-tech Industry". It was published by Fang et al. (2019) in Industrial Management & Data Systems and has played a prominent role in shaping the discourse within this cluster. Additionally, the works by Nahapiet and Ghoshal (1998), Burt (2004), and Fornell and Larcker (1981) emerged as highly cited contributions within this cluster, further attesting to their scholarly impact and influence.
Cluster #1 was the second largest cluster with 96 publications and exhibited a silhouette value of 0.769. It was identified as pertinent to the topics of "social network analysis" according to the LLR analysis, "social network theory" according to the LSI analysis, and "business school education" as indicated by the MI analysis. The most influential article within this cluster was "Alliance Formation in the Midst of Market and Network: Insights from Resource Dependence and Network Perspectives" by Xia et al. (2018), which was featured in the Journal of Management. Noteworthy members with high citations in this cluster include Freeman (1979), Adler and Kwon (2002), and Granovetter (1983).
Furthermore, Cluster #2 is the third largest cluster comprising 91 publications and demonstrating a silhouette value of 0.734. It was assigned the labels of "future research opportunities" by the LLR analysis, "social network" by the LSI analysis, and "environmental governance" according to the MI analysis. Within this cluster, the primary citing article was the work by Yang and Dess (2007) titled "Where Do Entrepreneurial Orientations Come From? An Investigation on Their Social Origin", which was published in Entrepreneurial Strategic Processes Advances in Entrepreneurship Firm Emergence and Growth. Prominent members within this cluster who have received significant citations include Granovetter (1983), Uzzi (1997), and Hansen (1999) Figure 11.
Figure 11 Top 25 References in Social Network Theory and SME Research with the Strongest Citation Bursts
Figure presents the top 10 publications with the most powerful citation bursts along with the duration of each burst as indicated in the rightmost columns. The timeline spanned from 1994 to 2022 and is represented by the blue line while the burst period is denoted by the red line. Six articles emerged as the most recent bursts. The first article, “Structural Holes and Good Ideas”, was authored by Burt (2004) and published in the American Journal of Sociology, with a burst strength of 5.46 and a duration from 2020 to 2022. The second article, “Common Method Biases in Behavioral Research: A Critical Review of the Literature and Recommended Remedies”, was authored by Podsakoff et al. (2003) and exhibited a burst strength of 5.18, with a duration spanning from 2017 to 2022. The third article was “On Network Theory” by Borgati and Halgin (2011), which showcased a burst strength of 3.62 and covered the period from 2019 to 2022.
Meanwhile, the fourth article was “Evaluating Structural Equation Models with Unobservable Variables and Measurement Error” by Fornell and Larcker (1981). It possessed a burst strength of 3.55 and a duration spanning from 2019 to 2022. Sheng et al. (2011) authored the fifth article titled “The Effects of Business and Political Ties on Firm Performance: Evidence from China”, which was published in the Journal of Marketing. It attained a burst strength of 3.54 and covered the period from 2020 to 2022. The sixth article, “Network Analysis in the Social Sciences” by Borgatti et al. (2009), demonstrated a burst strength of 3.45 and covered a duration from 2020 to 2022 Figure 12.
Figure 12 Top 9 Keywords in Social Network Theory and SME Research with the Strongest Citation Bursts
As shown in, the timeline (from 1994 to 2022) is shown by the blue line while the red line denotes the burstiness phase. The most significant or influential studies and keywords were found using a burst analysis; trends among studies and keywords are shown in the table. The term “knowledge transfer” had the strongest burst strength between 2017 and 2019. Meanwhile, the most recent keyword burst is “firm performance” with a burst strength of 3.3.48 between 2020 and 2022.
Discussion
Social network analysis has indeed experienced a surge in interest and has become a valuable tool for social scientists in explaining various social phenomena. It has been applied across multiple disciplines, such as psychology, economics, and sociology. Hence, it is crucial to understand the structure, dynamics, and effects of social networks on individuals, groups, and societies. The social network analysis assumes that social structures are representable as networks where individuals or entities are depicted as nodes while the interactions or relationships between them are represented as edges or ties. Researchers need to uncover patterns and properties within networks (April et al., 2009). Besides, it is vital to dissect and characterise network theorising. A significant portion of the network theory and methodology is based on the flow model, which has been well elaborated and serves as a unifying framework for understanding networks. Researchers should bond the model, which has the potential to unify several other areas of inquiry within network research (Borgatti & Halgin, 2011). These patterns can include measures of centrality, such as identifying individuals who are highly connected or influential within a network or identifying subgroups or communities within the larger network structure. A thorough examination of these patterns will lead to a proper understanding of the underlying mechanisms that shape social relationships and influence social behaviour. These ties can be influenced by numerous factors, including friendship, communication, collaboration, information flow, or other relevant social connections (April et al., 2009). By understanding the patterns, properties, and dynamics of social networks, a wide range of social phenomena will contribute to interdisciplinary dialogue among physical and social scientists who share an interest in network phenomena. This subsequently suggests that business ties have a stronger positive effect on firm performance compared to political ties (Sheng et al., 2011). However, the impact of both types of ties depends on the specific institutional and market conditions. On the other hand, political ties are associated with greater performance when there is weak government support and low technological turbulence. Therefore, SMEs must adjust their utilisation of ties based on the changing institutional and market environments. A one-size-fits-all approach towards using social ties may not be effective and firms should carefully consider the specific context in which they operate.
Conclusion
This scientometric study has successfully identified the research clusters, authors, journals, and keywords with significant impacts on the social network analysis applied in SMEs, specifically in business economics research. The visualisation and co-citation techniques were applied to map the frontiers of the specialty, interconnections between publications in the corpus, and prominent research trends. Nevertheless, a noticeable gap in research remains and calls for additional exploration, particularly in the domain of the social network theory and its relationship with SMEs. Future research can investigate the evolution of social network theory across all relevant areas.
References
Adler, P. S., & Kwon, S. W. (2002). Social capital: Prospects for a new concept. Academy of management review, 27(1), 17-40.
Indexed at, Google Scholar, Cross Ref
Adriaanse, L. S., & Rensleigh, C. (2013). Web of Science, Scopus and Google Scholar: A content comprehensiveness comparison. The Electronic Library, 31(6), 727-744.
Indexed at, Google Scholar, Cross Ref
April, C., Page, S. E. E. L., Borgatti, S. P., Mehra, A., Brass, D. J., & Labianca, G. (2009). Networks reading for monday. 323(April), 892–896.
Borgatti, S. P., & Halgin, D. S. (2011). Borgatti &Halgin.Pdf. Organization Science, 22(5), 1168–1181.
Borgatti, S. P., & Halgin, D. S. (2011). On network theory. Organization science, 22(5), 1168-1181.
Borgatti, S. P., Mehra, A., Brass, D. J., & Labianca, G. (2009). Network analysis in the social sciences. science, 323(5916), 892-895.
Indexed at, Google Scholar, Cross Ref
Burt, R. S. (2004). Structural holes and good ideas. American journal of sociology, 110(2), 349-399.
Indexed at, Google Scholar, Cross Ref
Chen, C. (2016). CiteSpace: a practical guide for mapping scientific literature (pp. 41-44). Hauppauge, NY, USA: Nova Science Publishers.
Chen, C. (2020) How to use CiteSpace Lean Publishing British Columbia Canada p 246
Fang, G., Zhou, Q., Wu, J., & Qi, X. (2019). The relationship between network capabilities and innovation performance: Evidence from Chinese high-tech industry. Industrial management & data systems, 119(8), 1638-1654.
Indexed at, Google Scholar, Cross Ref
Fornell, C., & Larcker, D. F. (1981). Evaluating structural equation models with unobservable variables and measurement error. Journal of marketing research, 18(1), 39-50.
Indexed at, Google Scholar, Cross Ref
Freeman, L. C. (2002). Centrality in social networks: Conceptual clarification. Social network: critical concepts in sociology. Londres: Routledge, 1, 238-263.
Indexed at, Google Scholar, Cross Ref
Granovetter, M. (1985). Economic action and social structure: The problem of embeddedness. American journal of sociology, 91(3), 481-510.
Indexed at, Google Scholar, Cross Ref
Hansen, M. T. (1999). The search-transfer problem: The role of weak ties in sharing knowledge across organization subunits. Administrative science quarterly, 44(1), 82-111.
Indexed at, Google Scholar, Cross Ref
Lechner, C., & Dowling, M. (2003). Firm networks: external relationships as sources for the growth and competitiveness of entrepreneurial firms. Entrepreneurship & regional development, 15(1), 1-26.
Indexed at, Google Scholar, Cross Ref
Lefebvre, V. (2022). Performance, working capital management, and the liability of smallness: A question of opportunity costs?. Journal of Small Business Management, 60(3), 704-733.
Indexed at, Google Scholar, Cross Ref
Nahapiet, J., & Ghoshal, S. (1998). Social capital, intellectual capital, and the organizational advantage. Academy of management review, 23(2), 242-266.
Indexed at, Google Scholar, Cross Ref
Noor, M. I. M., Awang, N., & Abdullah, M. F. (2023). A Scientometric Review of Solar Energy Research in Business Economics. Journal of Scientometric Research, 12(1), 114-129.
Indexed at, Google Scholar, Cross Ref
OECD, P. (2017). Enhancing the contributions of SMEs in a global and digitalised economy. Paris. Retrieved Feb, 25, 2019.
Podsakoff, P. M., MacKenzie, S. B., Lee, J. Y., & Podsakoff, N. P. (2003). Common method biases in behavioral research: a critical review of the literature and recommended remedies. Journal of applied psychology, 88(5), 879.
Indexed at, Google Scholar, Cross Ref
Savlovschi, L. I., & Robu, N. R. (2011). The role of SMEs in modern economy. Economia, Seria Management, 14(1), 277-281.
Sharafizad, J., & Brown, K. (2020). Regional small businesses’ personal and inter-firm networks. Journal of Business & Industrial Marketing, 35(12), 1957-1969.
Indexed at, Google Scholar, Cross Ref
Sheng, S., Zhou, K. Z., & Li, J. J. (2011). The effects of business and political ties on firm performance: Evidence from China. Journal of Marketing, 75(1), 1-15.
Indexed at, Google Scholar, Cross Ref
Surin, E. F., & Ab Wahab, I. (2013). The effect of social network on business performance in established manufacturing small and medium enterprises (SMEs) in Malaysia. International Proceedings of Economics Development and Research, 67, 55.
Ulvenblad, P., & Barth, H. (2021). Liability of smallness in SMEs–Using co-creation as a method for the ‘fuzzy front end’of HRM practices in the forest industry. Scandinavian Journal of Management, 37(3), 101159.
Uzzi, B. (2018). Social structure and competition in interfirm networks: The paradox of embeddedness. In The sociology of economic life (pp. 213-241). Routledge.
Xia, J., Wang, Y., Lin, Y., Yang, H., & Li, S. (2018). Alliance formation in the midst of market and network: Insights from resource dependence and network perspectives. Journal of Management, 44(5), 1899-1925.
Indexed at, Google Scholar, Cross Ref
Xu, L., Ao, C., Liu, B., & Cai, Z. (2023). Ecotourism and sustainable development: a scientometric review of global research trends. Environment, Development and Sustainability, 25(4), 2977-3003.
Yang, H., & Dess, G. G. (2007). Where do entrepreneurial orientations come from? An investigation on their social origin. In Entrepreneurial strategic processes (pp. 223-247). Emerald Group Publishing Limited.
Received: 21-Jun-2024, Manuscript No. AEJ-24-15141; Editor assigned: 24-Jun-2024, PreQC No. AEJ-24-15141 (PQ); Reviewed: 09-Jul- 2024, QC No. AEJ-24-15141; Revised: 14-Jul-2024, Manuscript No. AEJ-24-15141 (R); Published: 21-Jul-2024
